If you’re a student or teacher looking to enhance your learning or teaching experience, you may have come across the KWL chart. This simple yet powerful tool is widely used in classrooms around the world to help organize thoughts and guide the learning process.
In this article, we will delve into the world of KWL charts, exploring what they are, why they are beneficial, how to create one, and tips for using them successfully.
What is a KWL Chart?
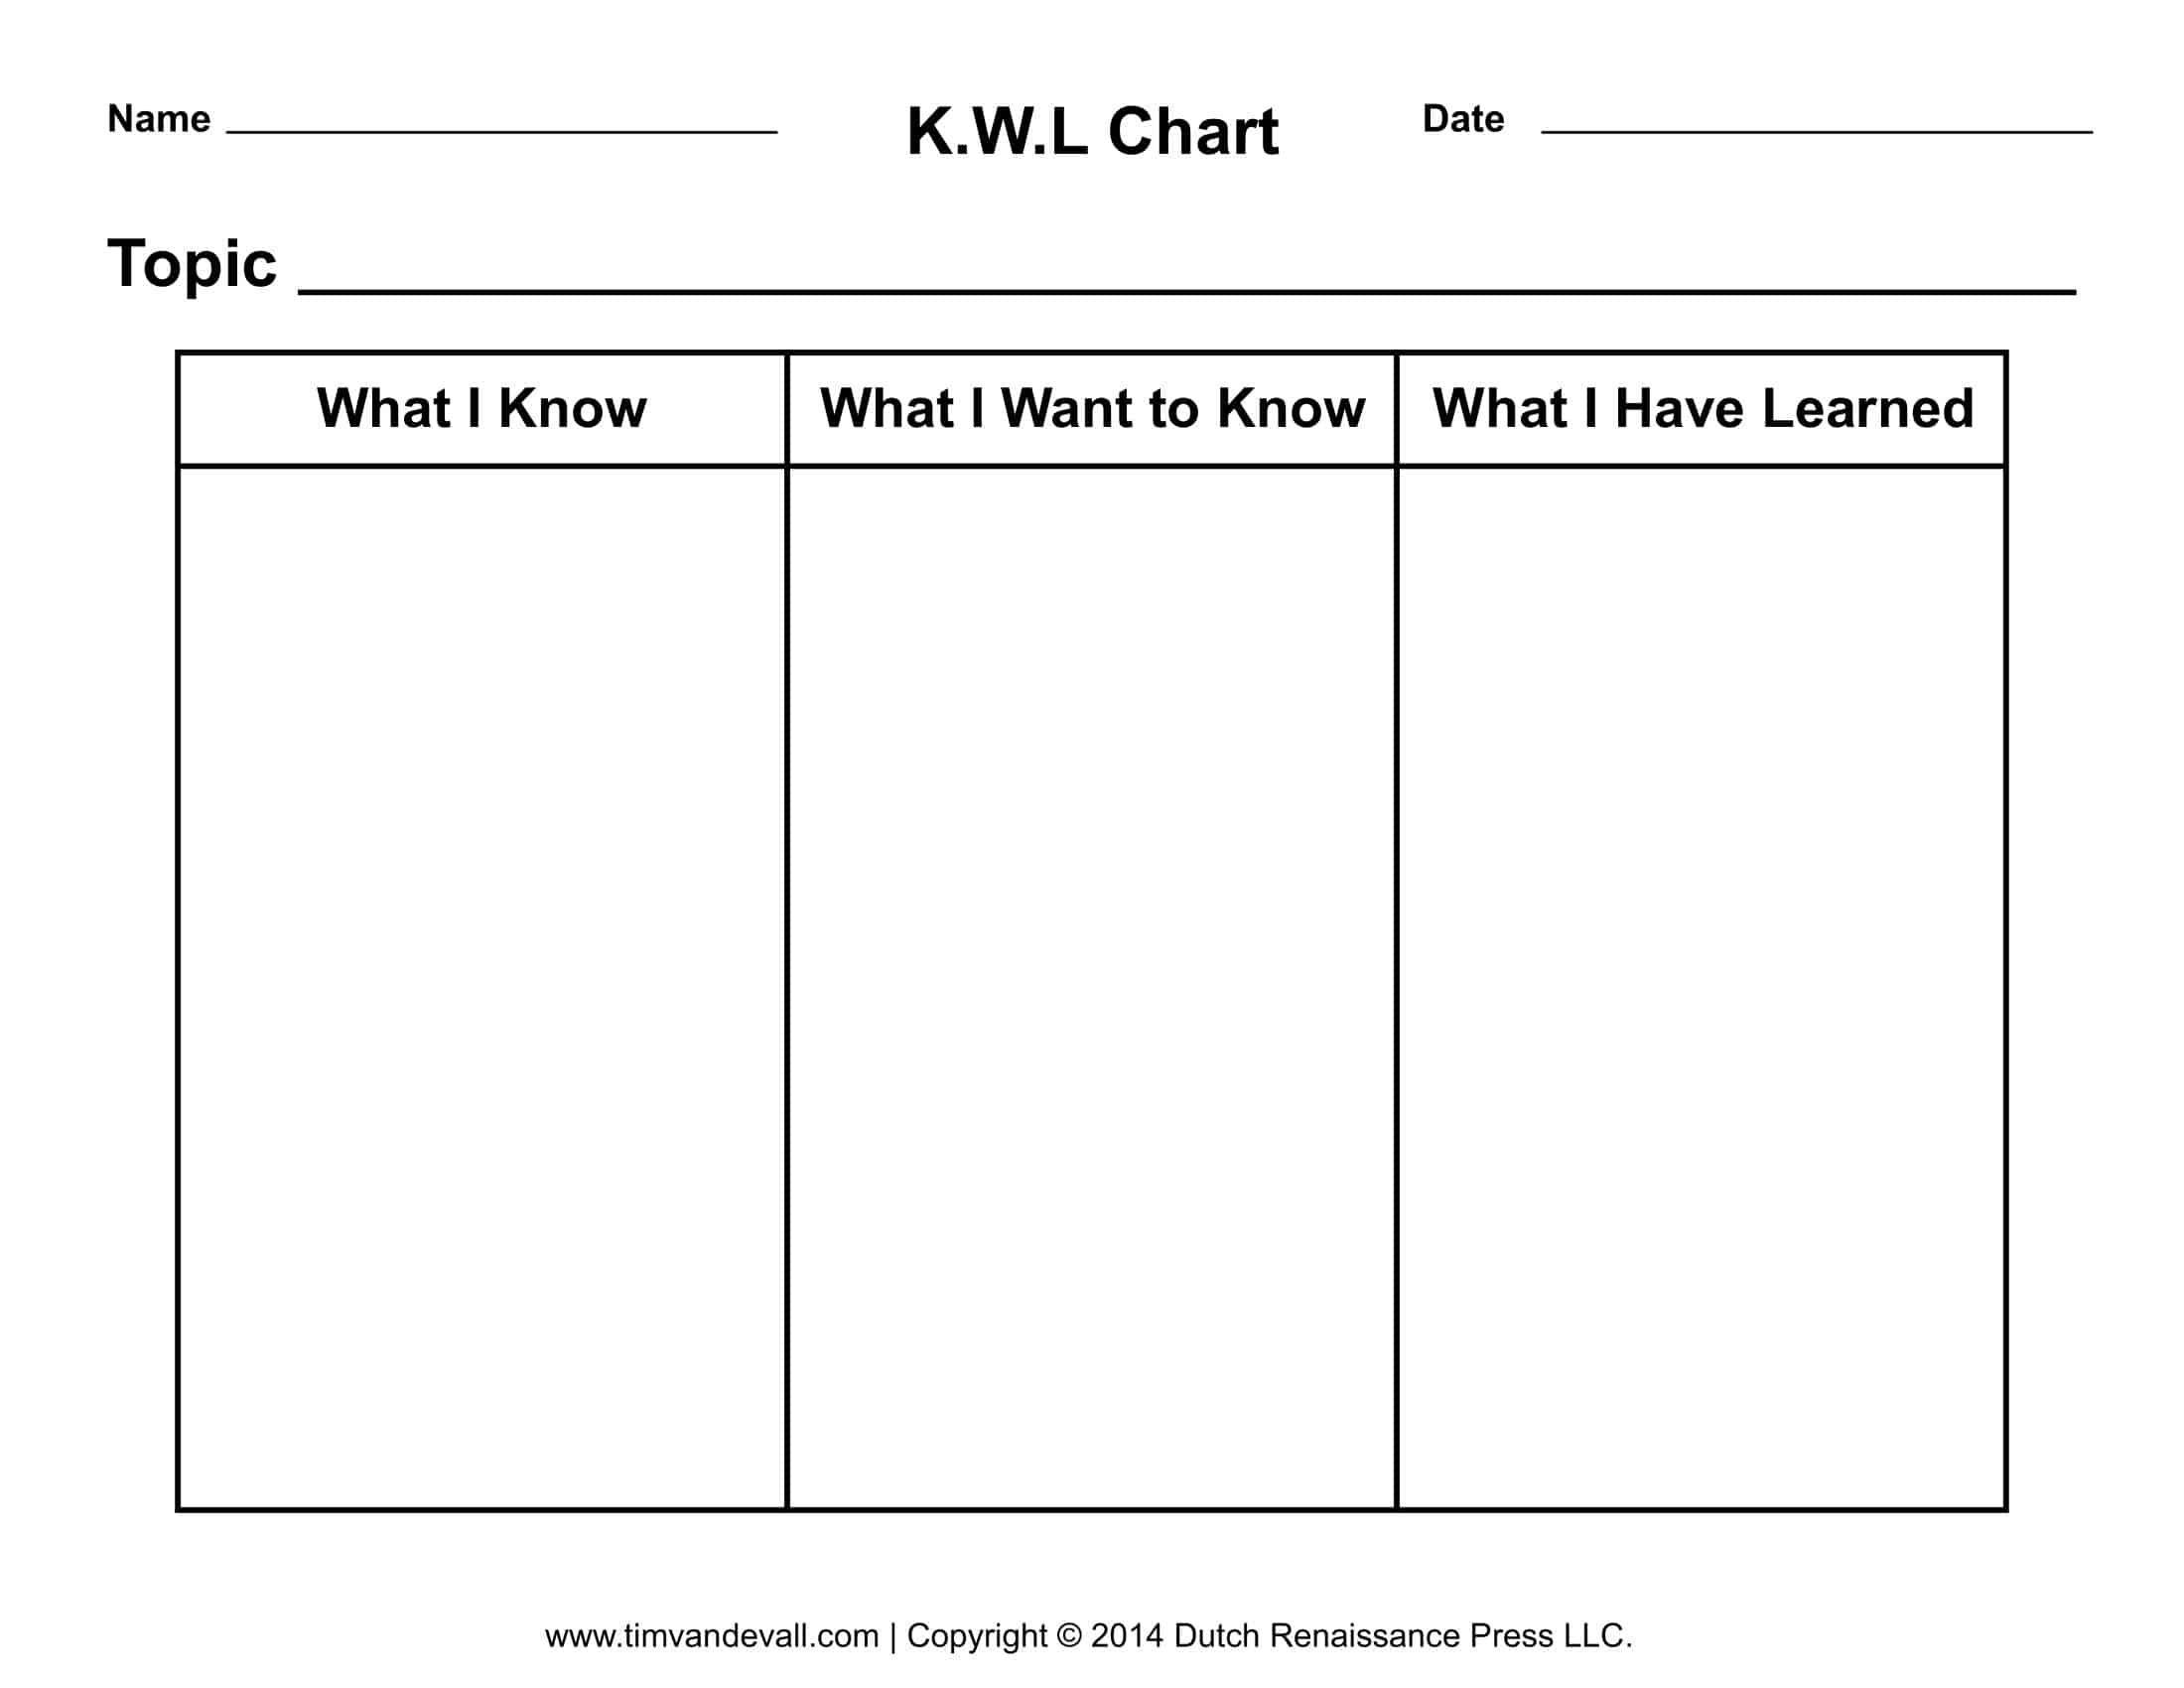
A KWL chart is a graphic organizer that helps individuals organize their thoughts and knowledge on a particular topic. The acronym “KWL” stands for “Know, Want to know, Learn.” The chart is divided into three columns, with each column serving a specific purpose. The “Know” column is where individuals jot down what they already know about the topic. The “Want to know” column is where they list questions or topics they are curious about and want to learn more about. The “Learn” column is where they record new information or insights gained through research or exploration.
Why Use a KWL Chart?
KWL charts are valuable tools for both students and teachers for several reasons. They help students activate prior knowledge, which can improve comprehension and retention of new information. By structuring thoughts and questions in a visual format, students can better organize their thoughts and focus on key concepts. Additionally, KWL charts promote active learning and engagement, as students are actively involved in the learning process by generating questions and seeking answers.
What to Include in a KWL Chart
When creating a KWL chart, it’s essential to include the following elements:
- Know: List what you already know about the topic.
- Want to know: Pose questions or topics you are curious about.
- Learn: Record new information or insights gained.
Examples


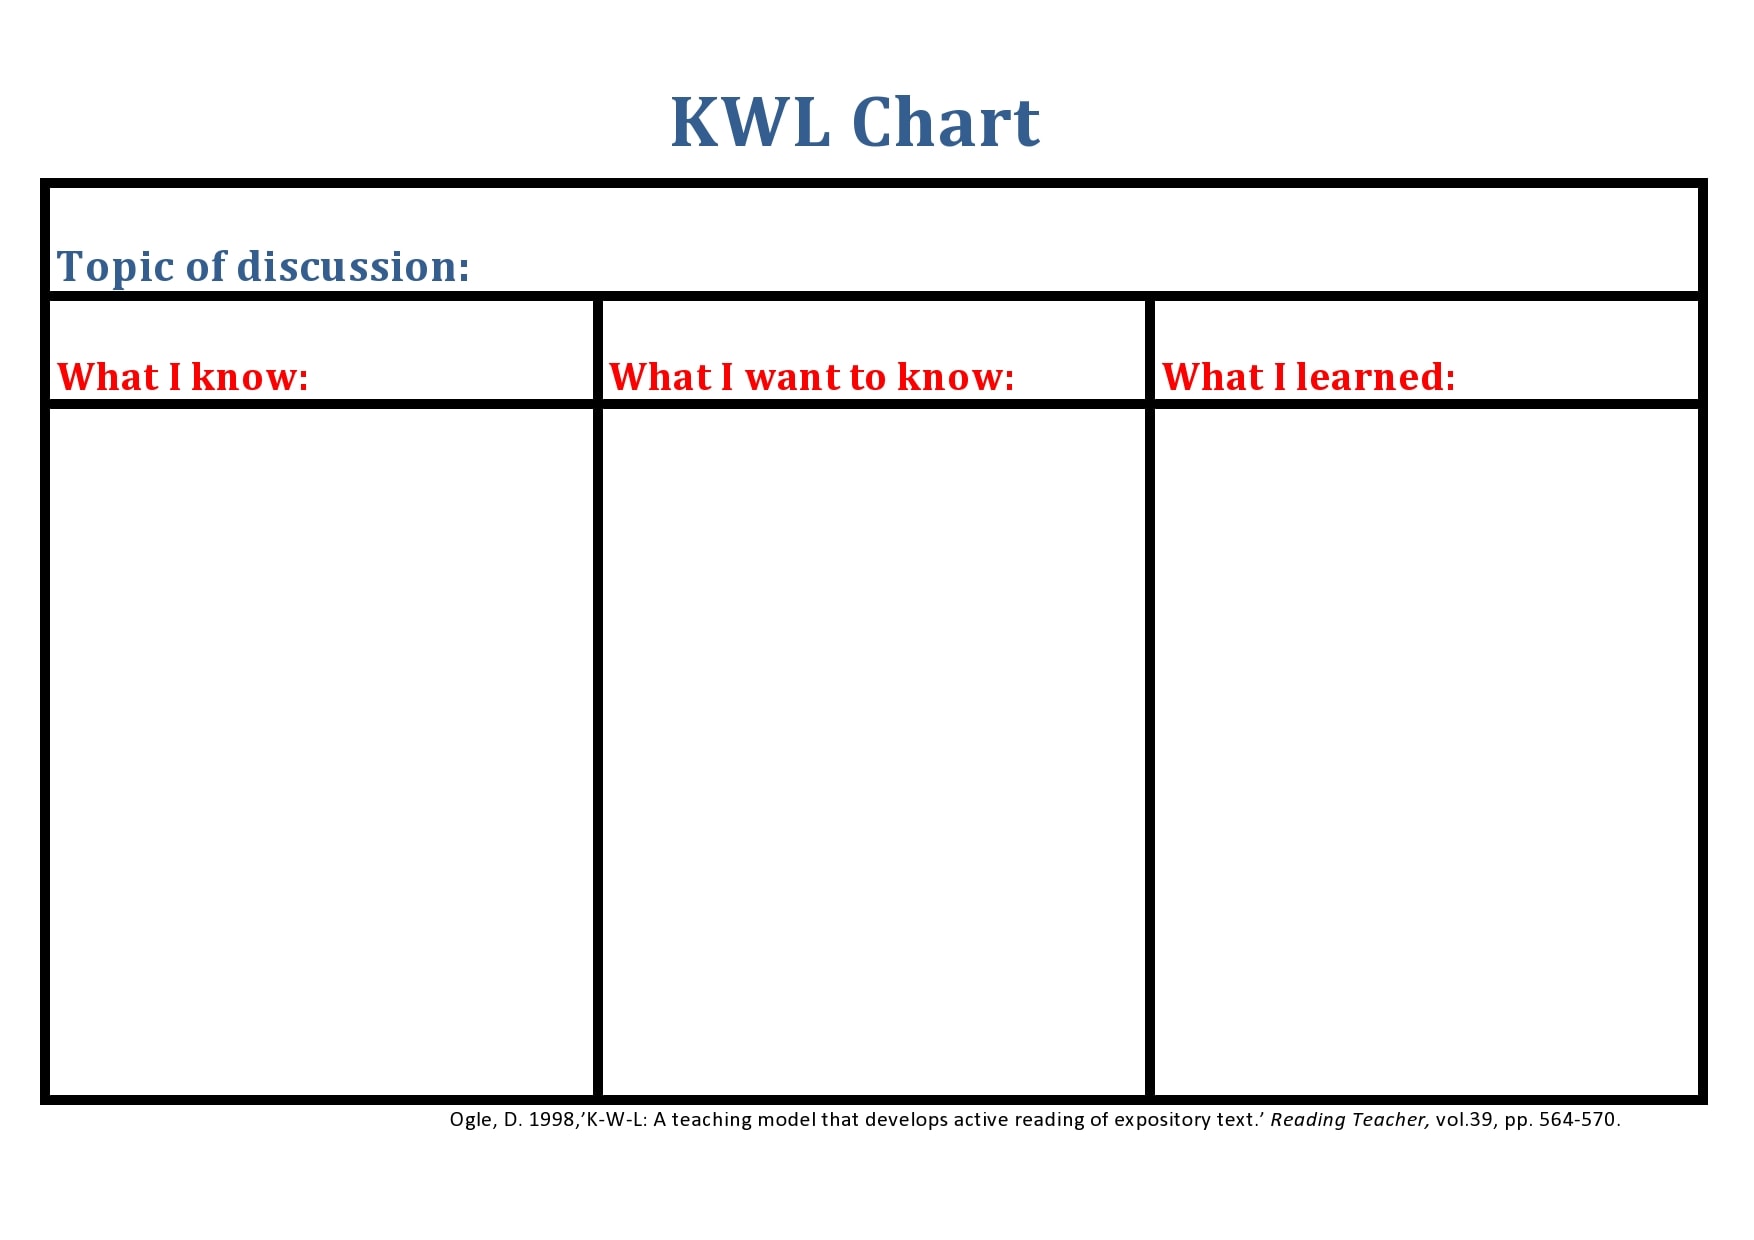
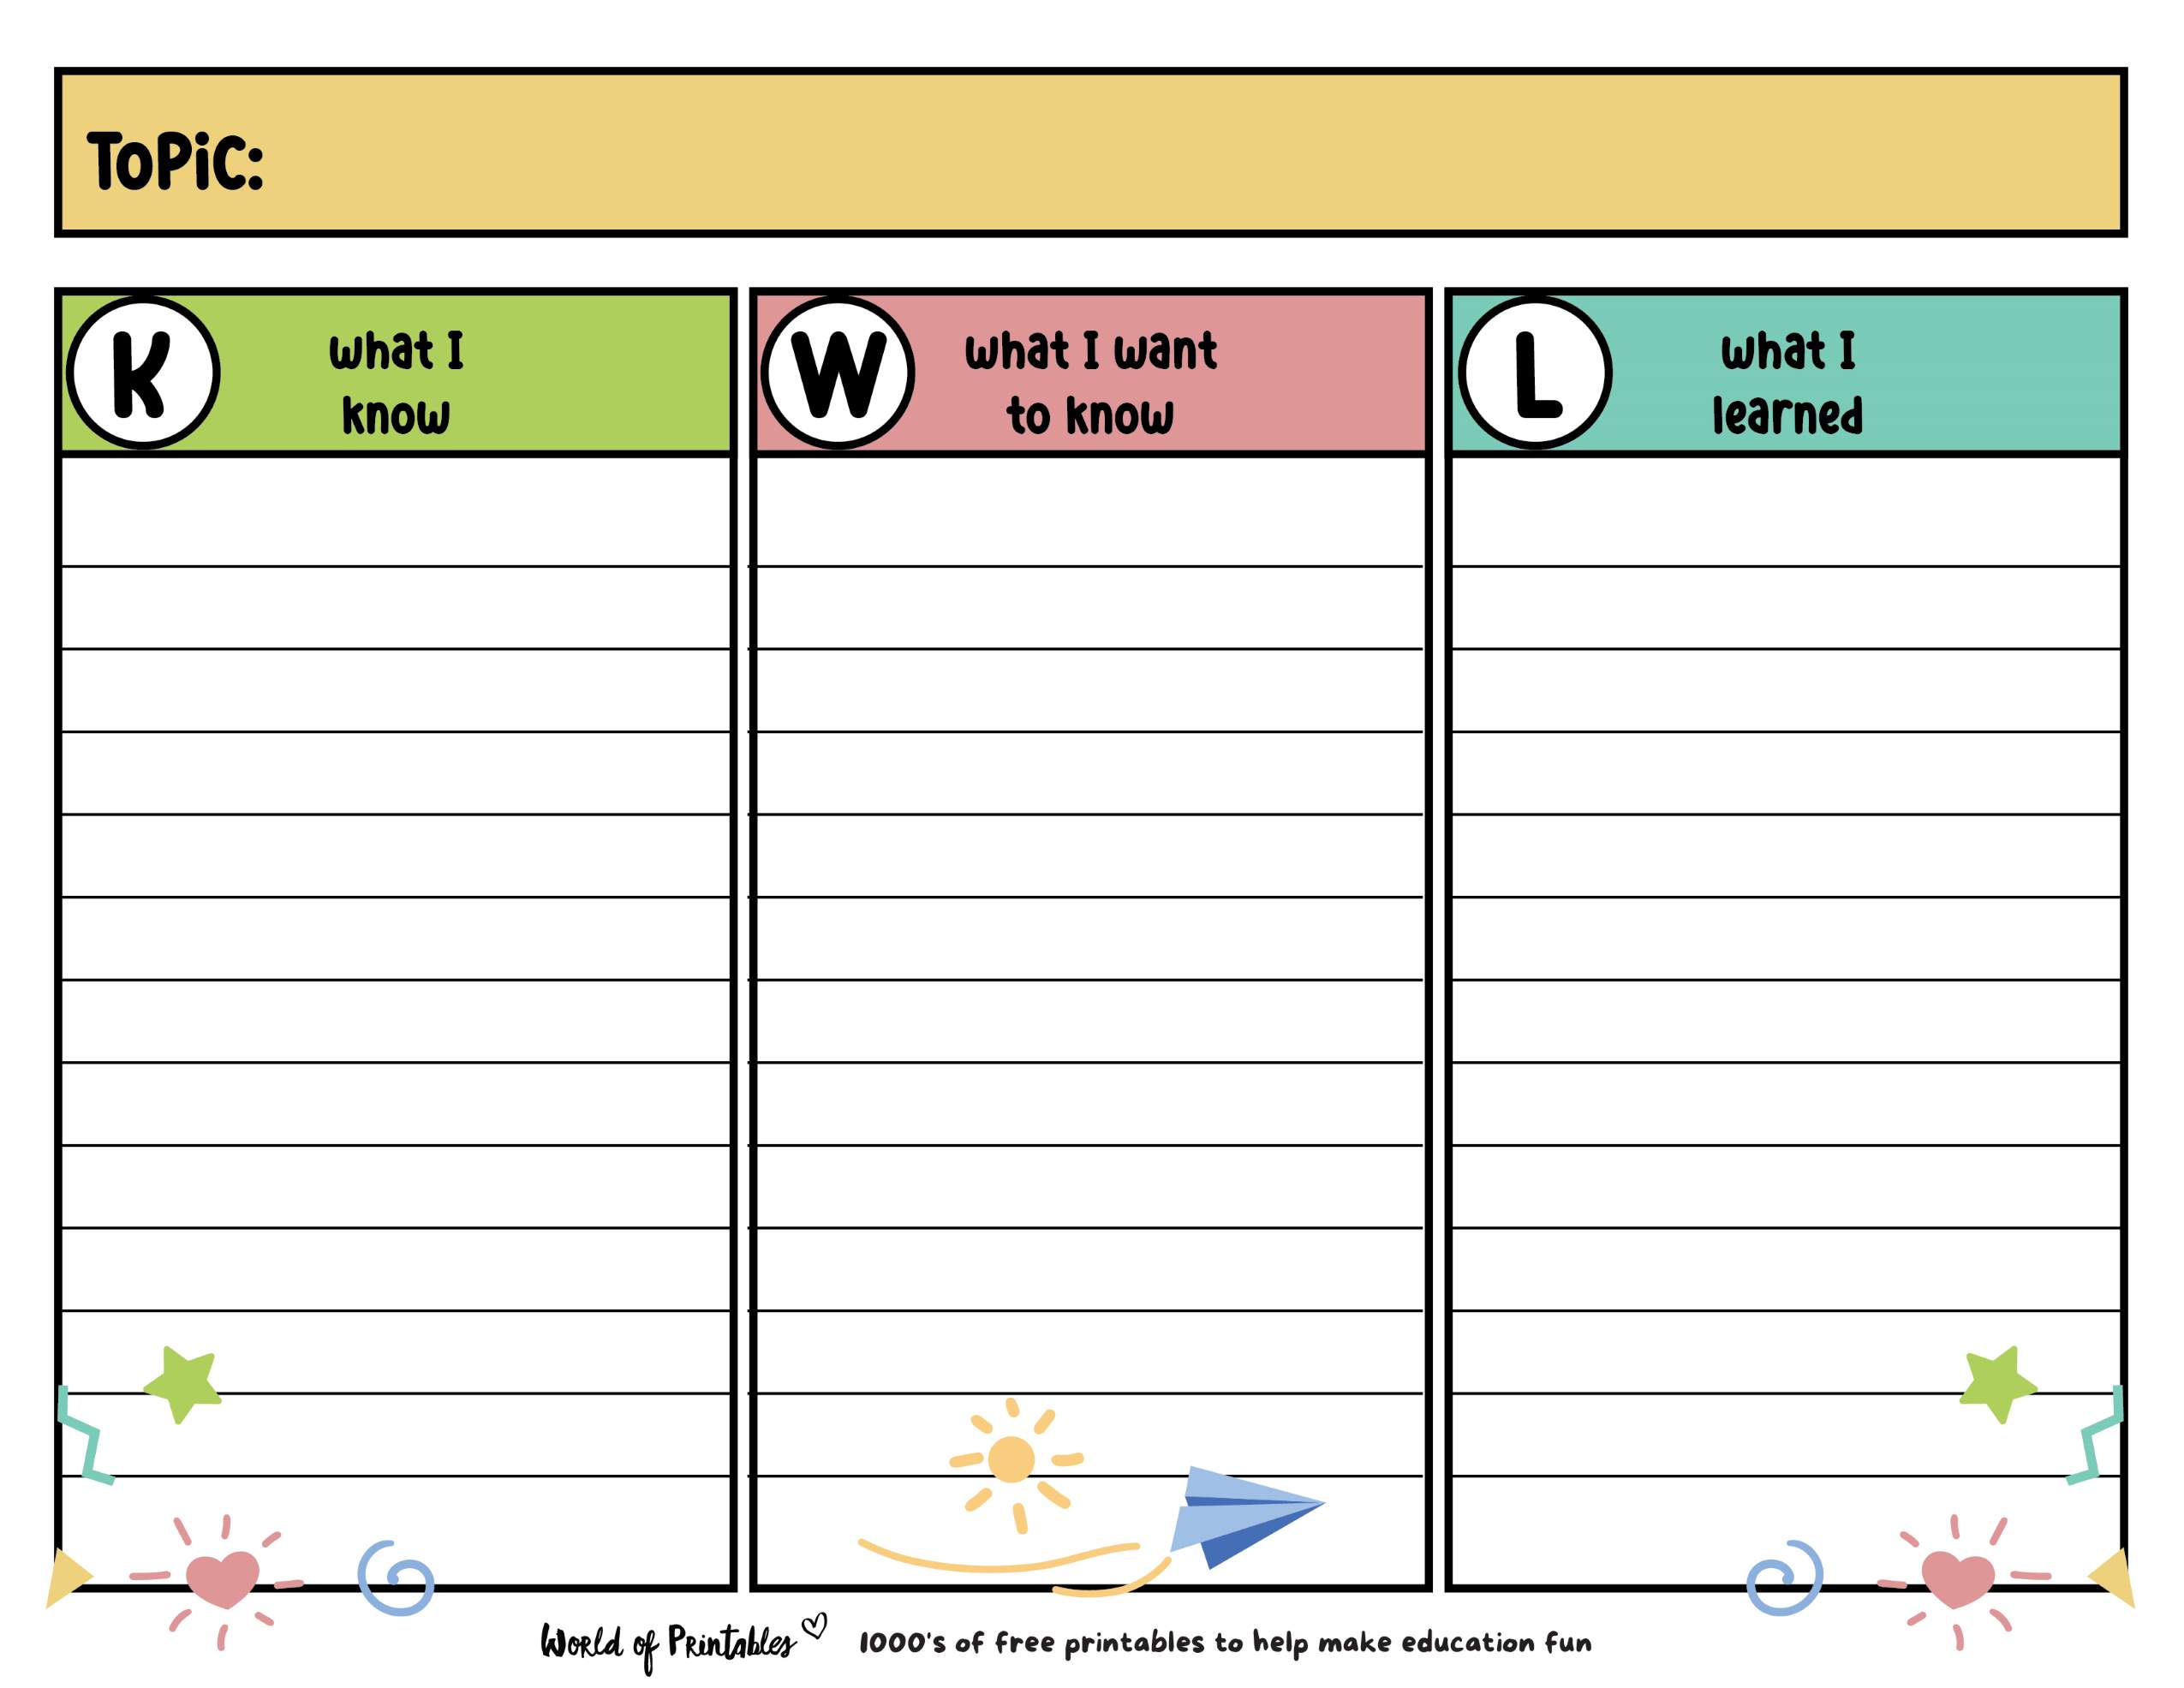


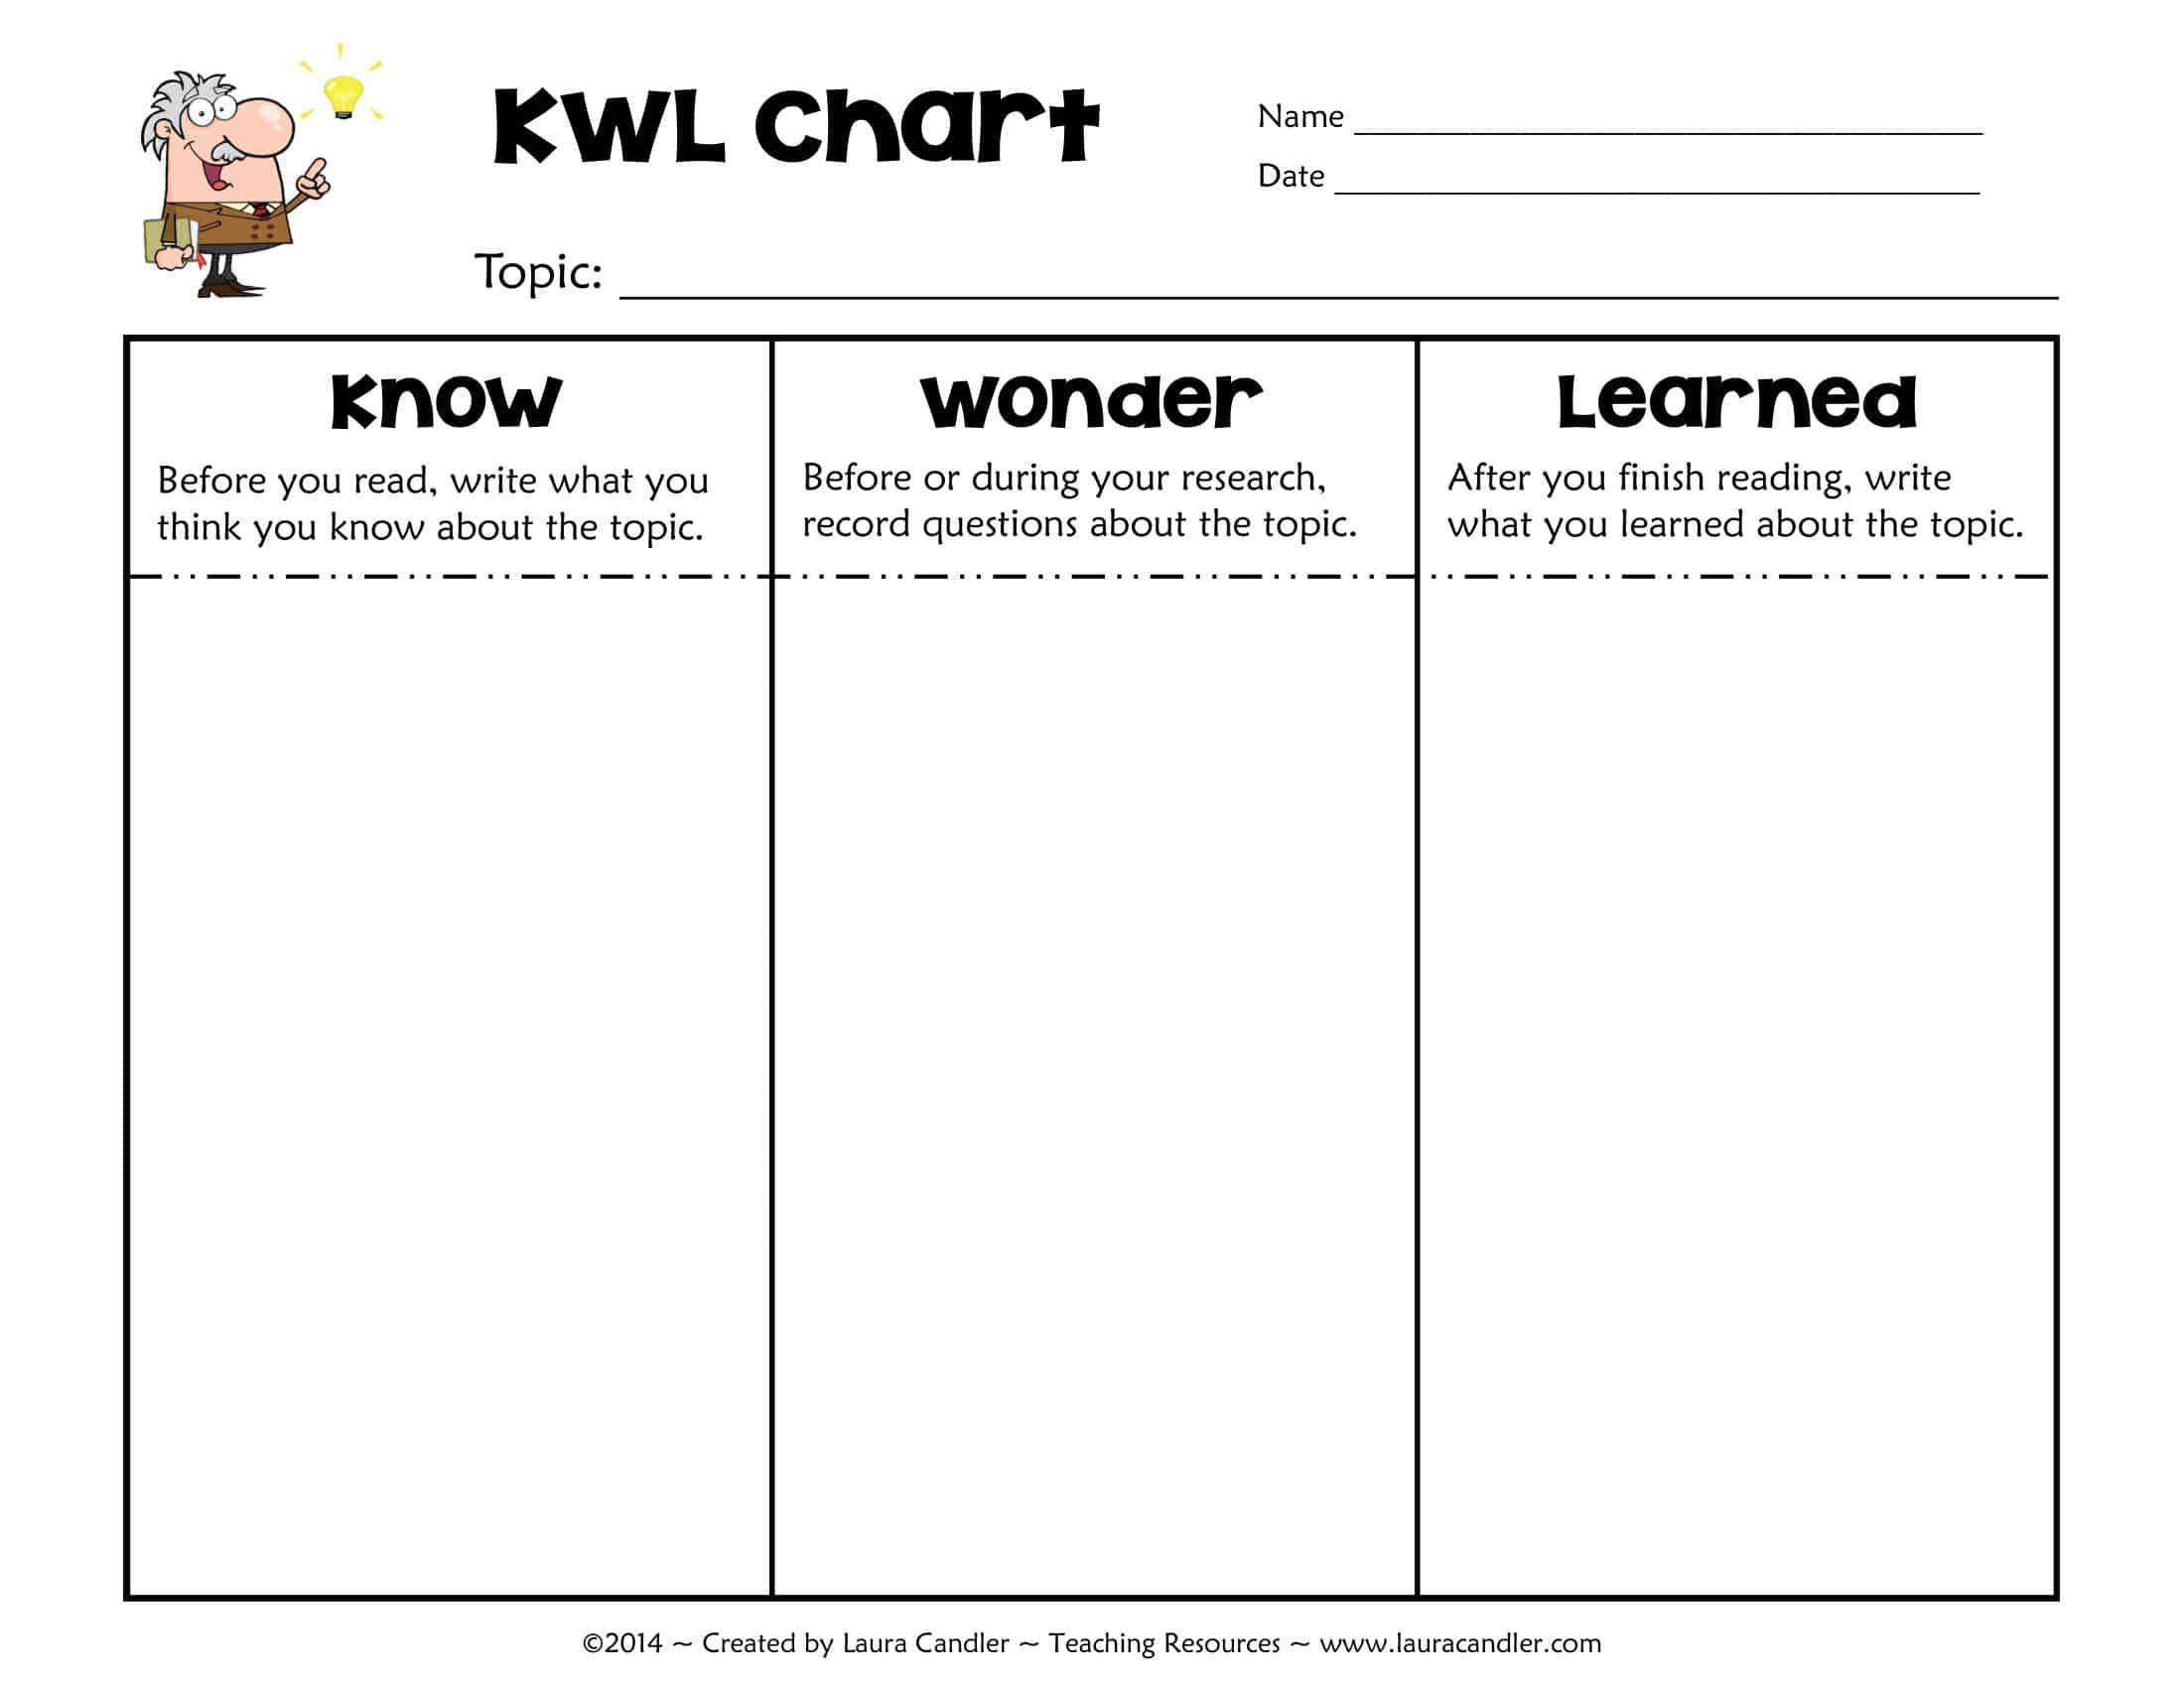
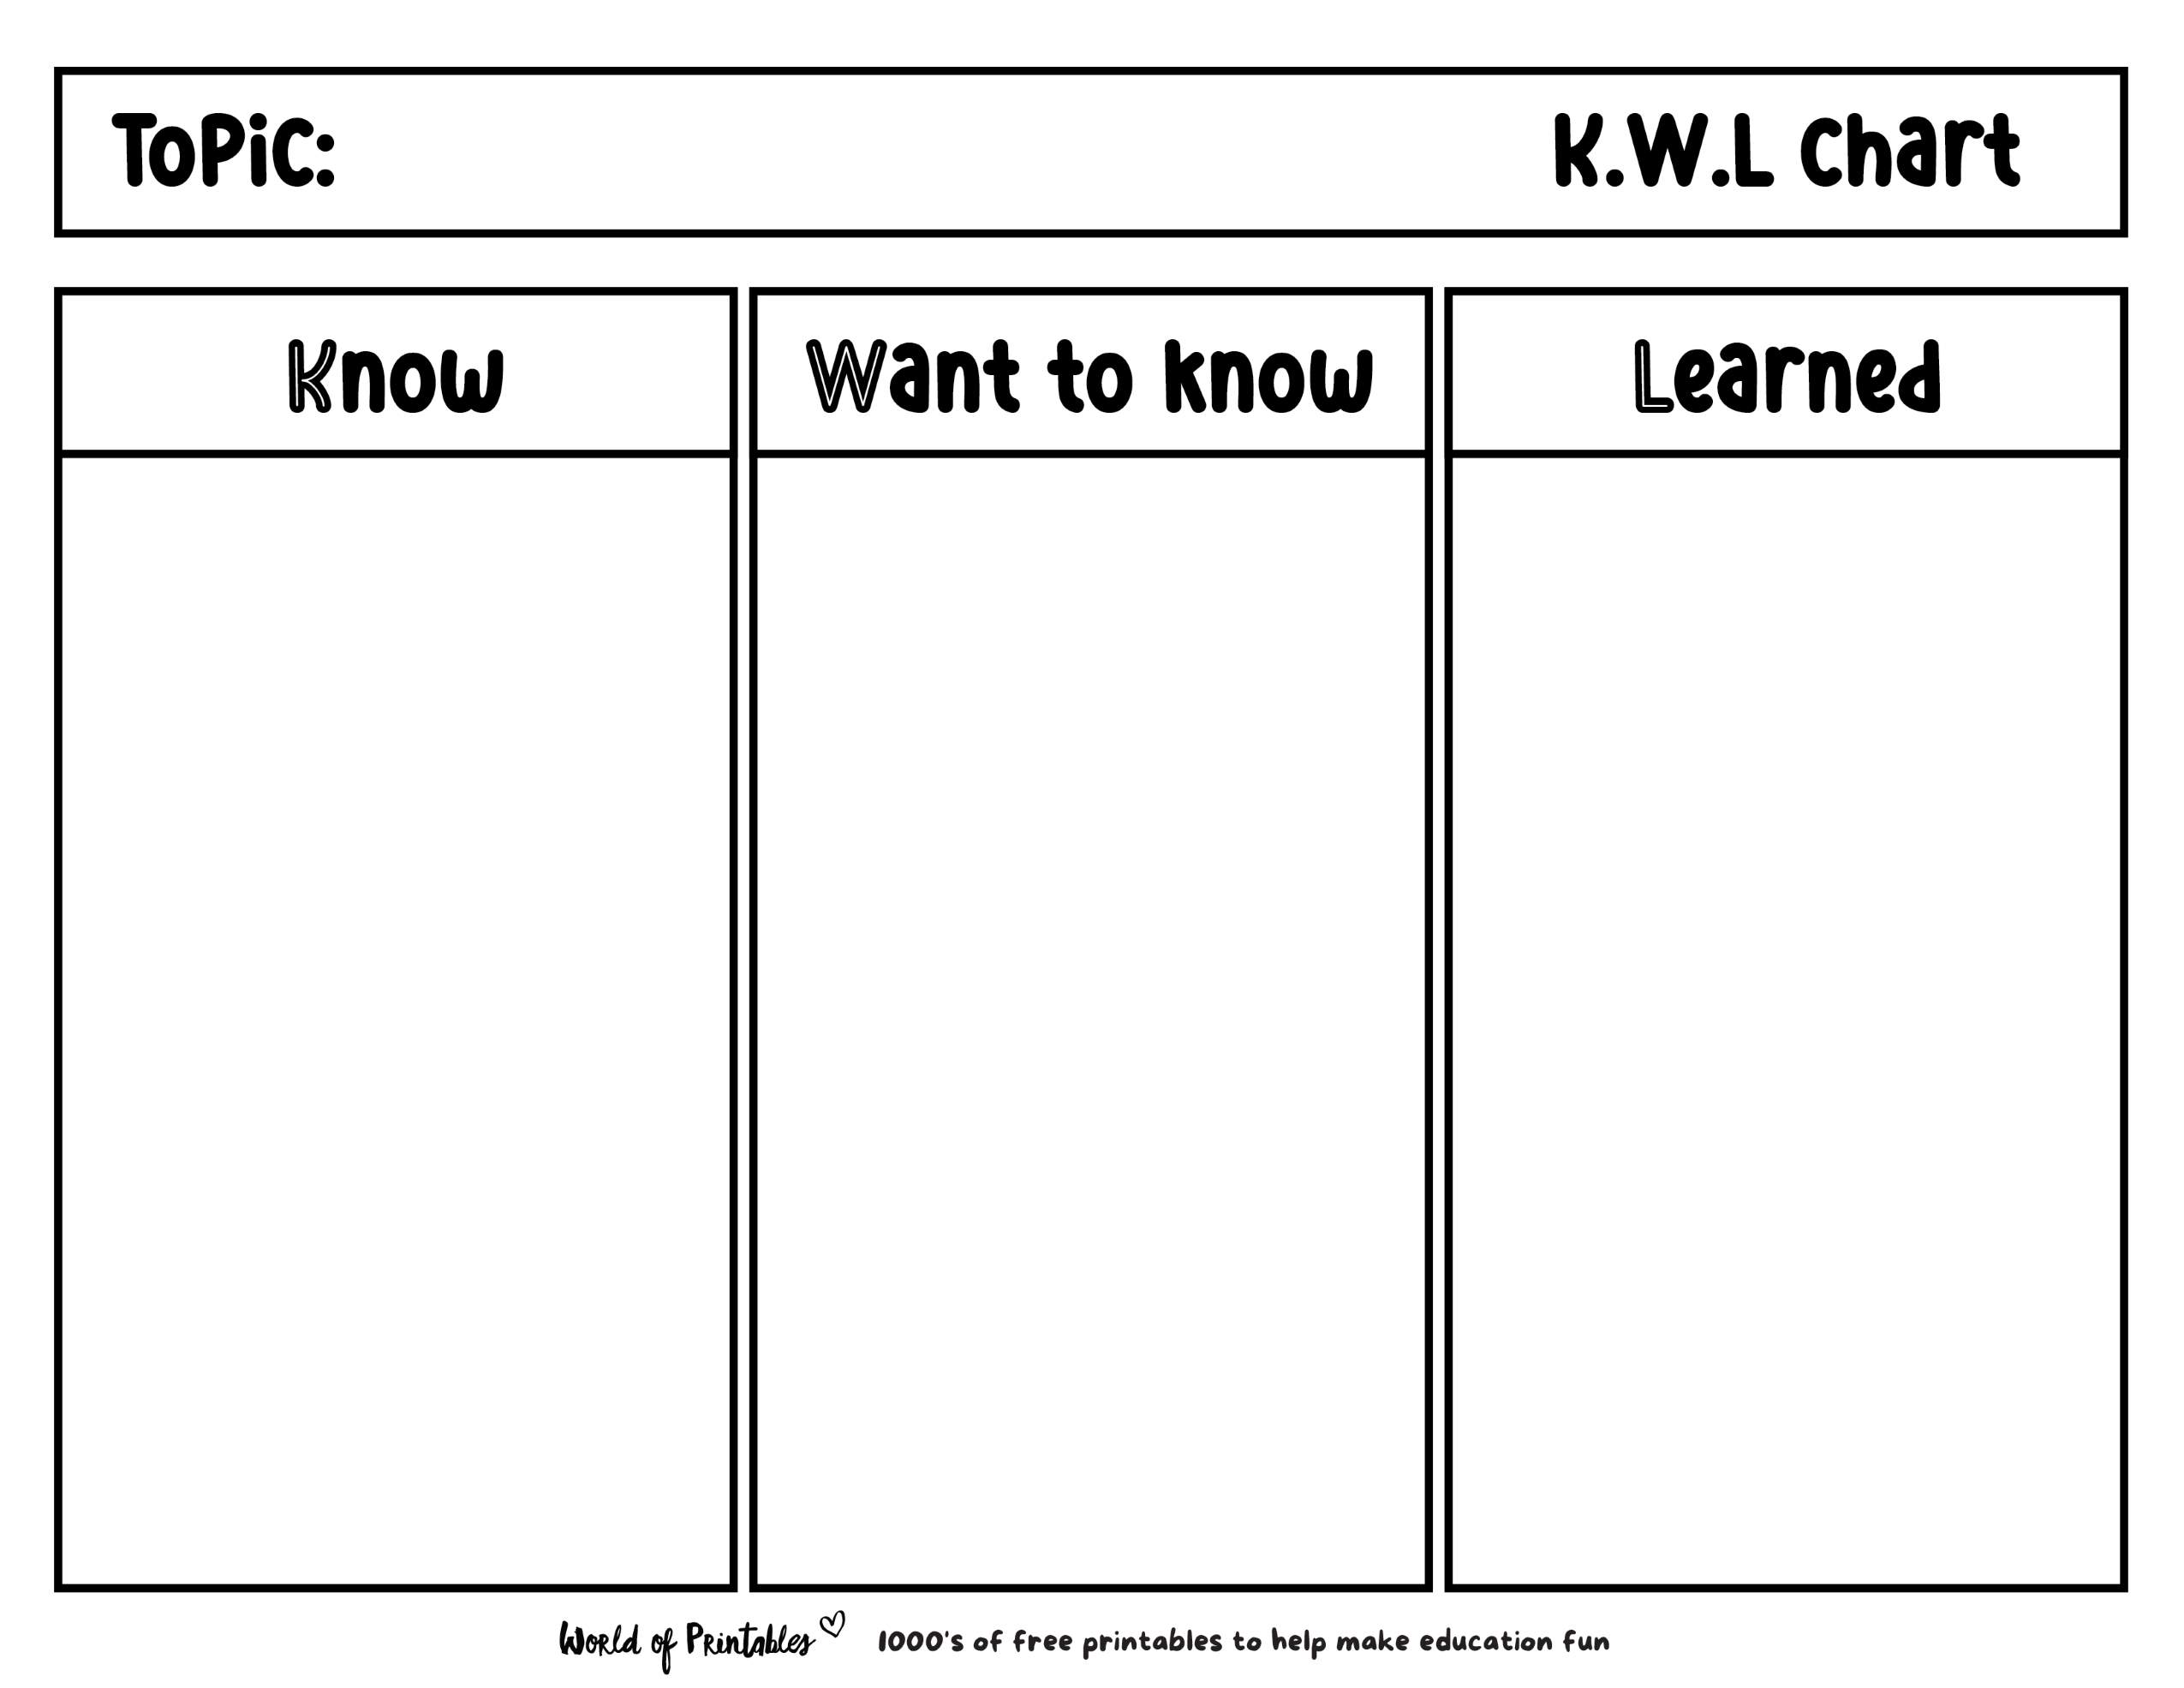
How to Create a KWL Chart
Creating a KWL chart is simple. Follow these steps to get started:
- Choose a topic or subject you want to explore.
- Draw three columns on a piece of paper or create a digital version using a tool like Microsoft Word or Google Docs.
- Title each column as “Know,” “Want to know,” and “Learn.”
- Fill in the “Know” column with what you already know about the topic.
- Generate questions or topics you are curious about and list them in the “Want to know” column.
- As you research or learn more about the topic, record new information or insights in the “Learn” column.
Tips for Successful Use of KWL Charts
Here are some tips to make the most out of your KWL chart:
- Engage actively: Encourage students to actively participate in filling out the chart and researching answers to their questions.
- Use as a formative assessment: Review students’ KWL charts to gauge their understanding of the topic and tailor instruction accordingly.
- Reflect and revisit: After completing the chart, take time to reflect on what was learned and revisit any unanswered questions for further exploration.
- Personalize the process: Allow students to customize their KWL charts based on their learning preferences and styles.
- Integrate technology: Explore digital tools and platforms to create interactive and collaborative KWL charts for a modern twist.
- Encourage creativity: Let students express themselves creatively through visuals, colors, and symbols in their KWL charts.
KWL Chart Template – Download
