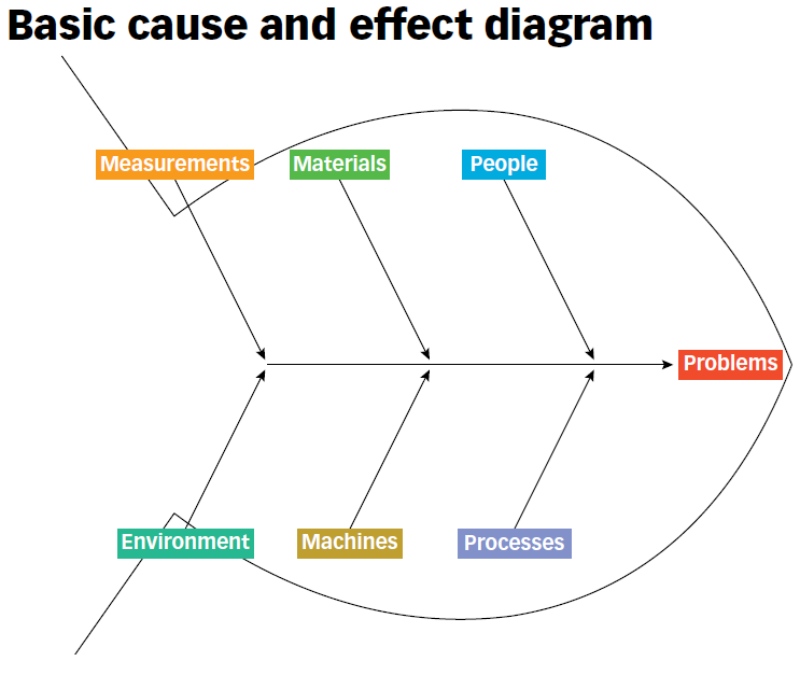
When it comes to problem-solving and root cause analysis, the Ishikawa Chart, also known as the Fishbone Diagram, is a powerful tool that can help teams identify and address the underlying issues causing a problem. Originally developed by Kaoru Ishikawa, a Japanese quality control expert, the Ishikawa Chart is widely used in various industries to visually depict the potential causes of a problem and facilitate brainstorming sessions to find solutions.
What is an Ishikawa Chart?
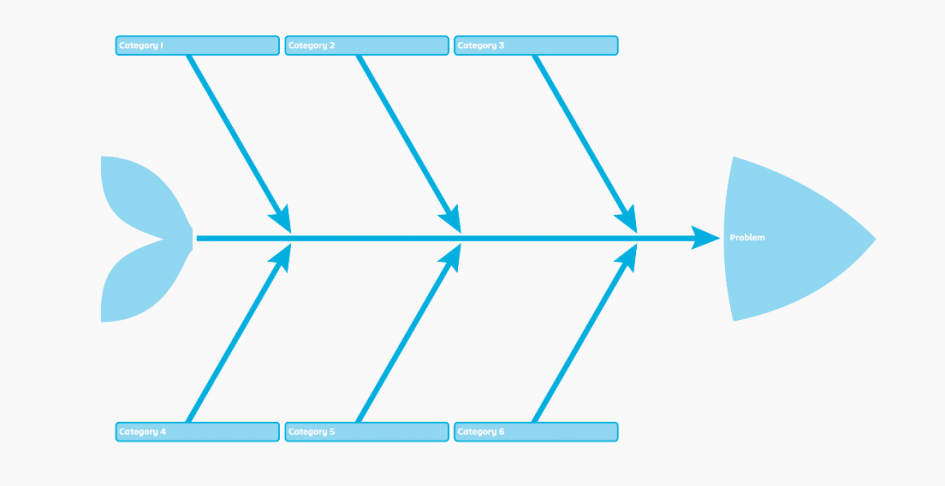
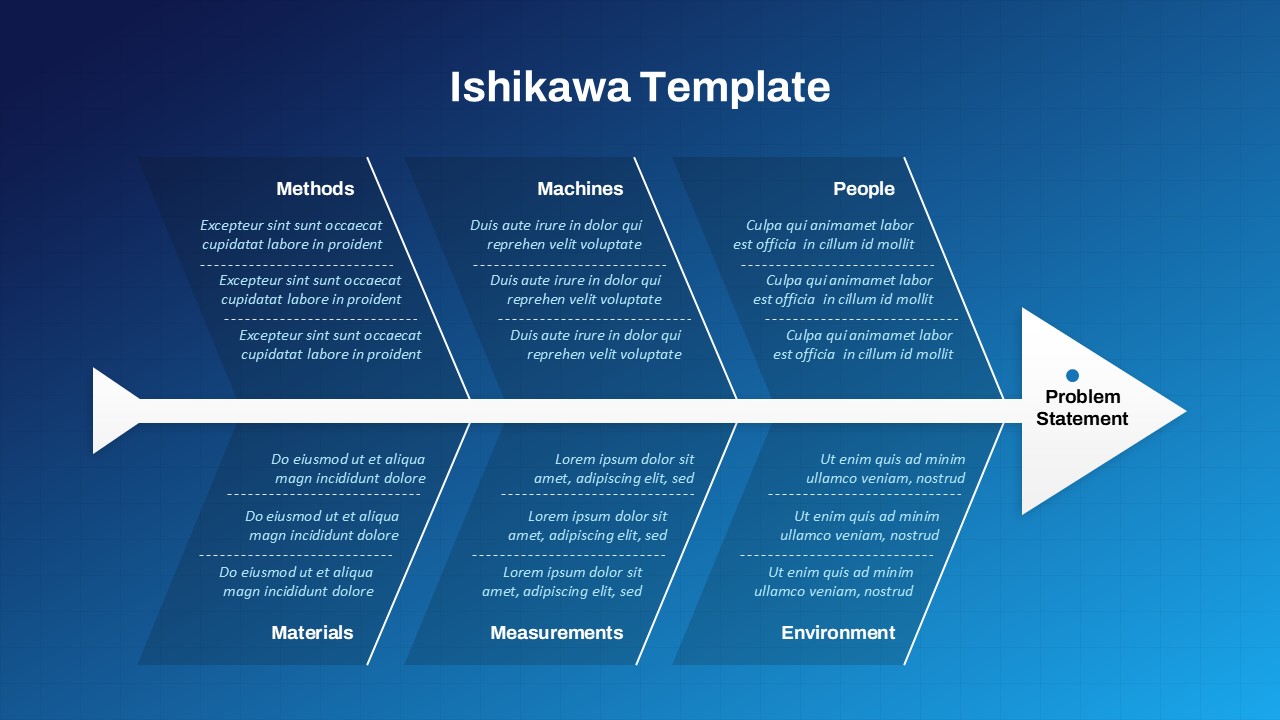
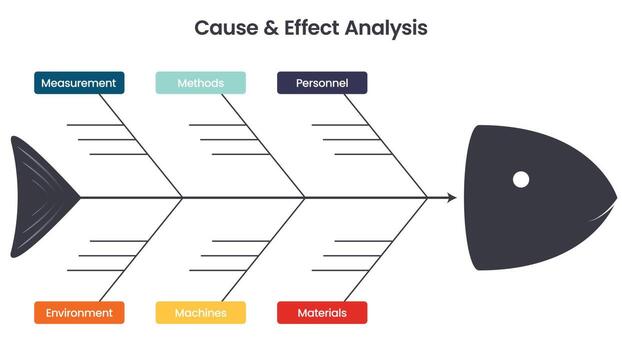
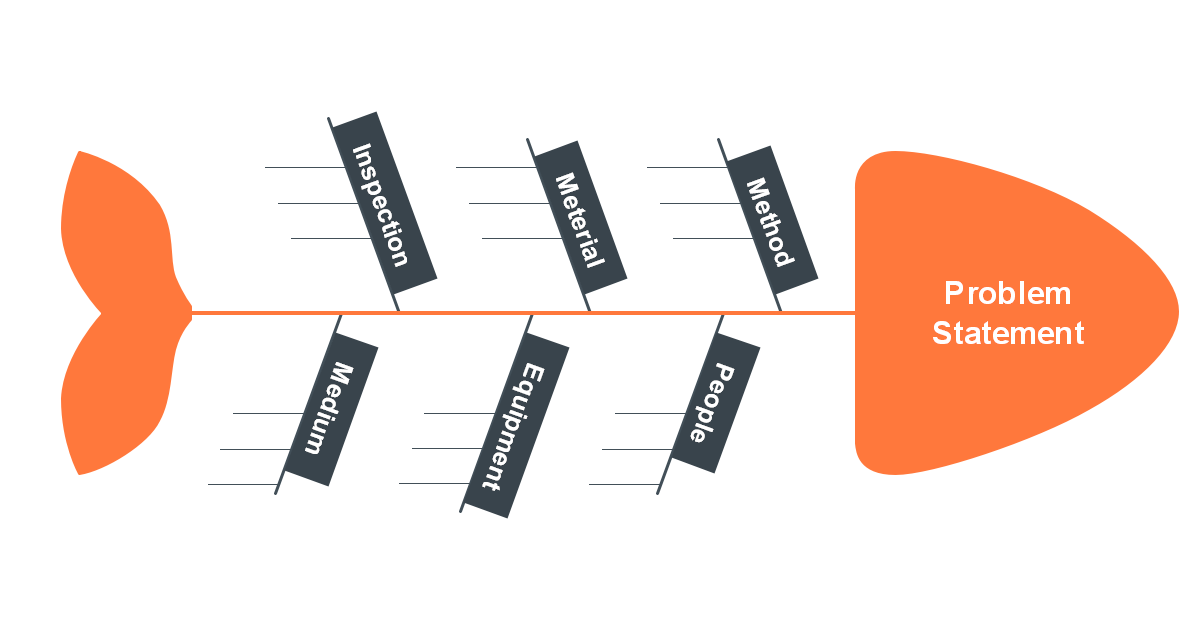
An Ishikawa Chart is a visual tool that resembles the skeleton of a fish, hence the name Fishbone Diagram. The head of the fish represents the problem or effect being analyzed, while the main bone of the fish represents the major categories of potential causes. These categories are typically labeled as the 6Ms: Manpower, Methods, Materials, Machinery, Measurements, and Environment. The smaller bones branching off the main bone represent more specific causes within each category.
Why Use an Ishikawa Chart?
The Ishikawa Chart is an effective tool for problem-solving and root cause analysis for several reasons:
- Visual Representation: It provides a clear and visual representation of the potential causes of a problem, making it easier for teams to understand and identify possible solutions.
- Brainstorming Aid: The chart serves as a brainstorming aid, encouraging team members to think critically and explore all possible causes of a problem.
- Organized Approach: By categorizing causes into specific groups, the Ishikawa Chart helps teams organize their thoughts and focus on key areas of concern.
- Data Analysis: It helps teams analyze data systematically and identify patterns or trends that may be contributing to the problem.
What to Include in an Ishikawa Chart?
When creating an Ishikawa Chart, it is important to include the following key elements:
- Problem Statement: Clearly define the problem or effect that needs to be addressed at the head of the fishbone diagram.
- Main Categories: Identify and label the main categories of potential causes (6Ms) that could be contributing to the problem.
- Subcategories: Break down each main category into subcategories or specific causes that fall under each main category.
- Contributing Factors: List all possible causes or factors that could be contributing to the problem under the appropriate category.
How to Create an Ishikawa Chart?
Creating an Ishikawa Chart involves the following steps:
1. Define the Problem:
Clearly articulate the problem or effect that needs to be analyzed using the Ishikawa Chart.
2. Identify Main Categories:
Determine the main categories of potential causes (6Ms) that could be influencing the problem.
3. Brainstorm Causes:
Engage team members in a brainstorming session to identify all possible causes and factors that could be contributing to the problem.
4. Organize Causes:
Categorize and organize the identified causes under the appropriate main category and subcategories on the Ishikawa Chart.
5. Analyze and Prioritize:
Analyze the causes listed on the chart and prioritize them based on their potential impact on the problem.
6. Develop Action Plan:
Once causes have been identified and analyzed, develop an action plan to address the root causes of the problem and implement solutions.
Tips for Successful Ishikawa Chart Implementation
Here are some tips to ensure a successful Ishikawa Chart implementation:
- Engage Cross-Functional Teams: Involve team members from different departments or disciplines to gain diverse perspectives on the problem.
- Use Facilitators: Consider having a facilitator lead the Ishikawa Chart session to ensure that all voices are heard and ideas are captured.
- Focus on Root Causes: Encourage team members to dig deep and identify the root causes of the problem rather than just addressing symptoms.
- Follow Up: Monitor progress and follow up on action items identified during the Ishikawa Chart session to ensure that solutions are implemented effectively.
By utilizing the Ishikawa Chart as a problem-solving tool, teams can effectively identify and address the root causes of complex issues, leading to improved processes and outcomes.
