A process chart is a visual tool used to show the sequence of steps, decisions, and actions involved in completing a process. By turning a complicated procedure into an easy-to-follow diagram, a process chart helps people understand how work is performed from beginning to end.
Businesses, schools, project teams, and organizations use process charts to document procedures, improve communication, identify bottlenecks, and create consistent workflows. A clear chart can also make employee training easier because people can quickly see what needs to happen, when it happens, and what decisions may change the next step.
Whether you are documenting a business workflow, planning a project, improving an operational procedure, or explaining a routine task, a well-organized process chart provides a simple visual roadmap.
What Is a Process Chart?
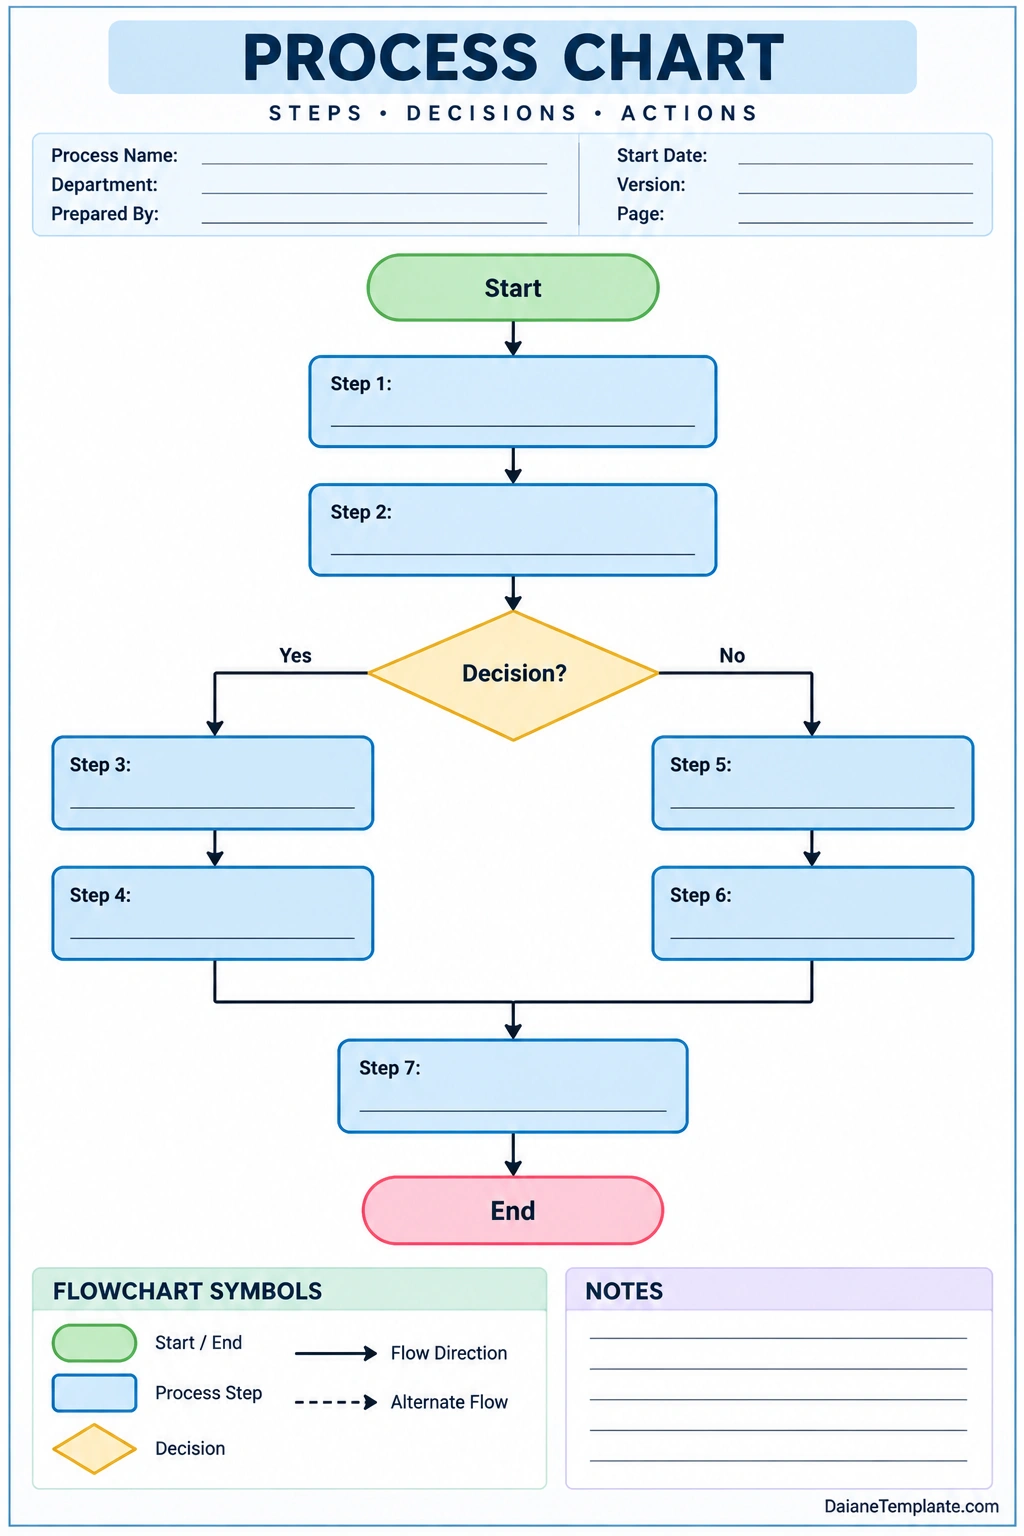
A process chart is a visual representation of the steps required to complete a particular process. It uses shapes, connecting lines, arrows, labels, and decision points to show how activities move from one stage to another.
A simple process chart may show a straightforward sequence from a starting point to an ending point. More detailed charts can include decisions, alternative paths, approvals, repeated activities, and multiple outcomes.
Process charts are closely related to flowcharts and workflow diagrams. While the terminology can vary, the primary purpose is the same: to make a process easier to understand, analyze, communicate, and improve.
Why Is a Process Chart Important?
A process chart can make an otherwise complicated procedure easier to understand. Instead of reading several paragraphs of instructions, users can follow a visual sequence and see how individual actions are connected.
Here are some of the main benefits of using a process chart:
- Improves understanding: Visual steps make complex procedures easier to follow.
- Clarifies responsibilities: A chart can show which actions need to happen and where responsibility changes.
- Identifies bottlenecks: Teams can spot delays, unnecessary steps, or repeated activities.
- Improves communication: A shared visual representation helps teams discuss the same process.
- Supports training: New employees can use a process diagram to learn standard procedures.
- Promotes consistency: Documented workflows help employees follow established procedures.
- Supports project planning: Teams can visualize dependencies and important decision points.
- Encourages process improvement: Reviewing each step can reveal opportunities to simplify the workflow.
Common Elements of a Process Chart
A process chart usually combines several visual elements. Each element has a specific purpose and helps readers understand the workflow.
Start and End Points
The start point identifies where the process begins, while the end point shows where the workflow finishes. These points provide a clear boundary for the process being documented.
Process Steps
Process steps represent individual actions or activities. Each step should use a short and clear description so that readers can understand what needs to happen without unnecessary detail.
Decision Points
A decision point represents a question or condition that determines what happens next. For example, a process may ask whether an application is complete. A “Yes” answer could move the process forward, while a “No” answer could send it back for additional information.
Arrows and Connectors
Arrows show the direction of the workflow. They connect individual steps and help readers follow the process in the correct order.
Notes and Supporting Information
More detailed process charts may include notes, explanations, responsible departments, required documents, or other information that helps users understand a particular step.
Types of Process Charts
Different processes require different levels of detail. Choosing the right type of process chart can make the information easier to understand.
Basic Process Flowchart
A basic flowchart presents a sequence of actions from beginning to end. It works well for simple procedures that have few decisions or alternative paths.
Workflow Process Chart
A workflow chart focuses on how tasks move between people, departments, systems, or stages. It is useful for documenting business operations and administrative procedures.
Decision Process Chart
A decision-based chart emphasizes conditions and alternative outcomes. It is useful when a process can follow different paths depending on the answer to a question or the result of an evaluation.
Cross-Functional Process Chart
A cross-functional process chart can show which department, team, or role is responsible for each stage. This type of diagram is useful for processes that involve multiple areas of an organization.
How to Create a Process Chart
Creating a process chart does not have to be complicated. The key is to understand the process before turning it into a visual diagram.
1. Define the Process
Start by deciding exactly what process you want to document. Define where the process begins and where it ends.
A narrow scope usually produces a more useful chart. Instead of attempting to document an entire business operation at once, focus on one procedure, workflow, or task.
2. List Every Major Step
Write down the actions required to complete the process. At this stage, focus on the actual workflow rather than the visual design.
Ask questions such as:
- What happens first?
- What happens next?
- Who performs each action?
- Are any documents or approvals required?
- Where are decisions made?
- What happens when a requirement is not met?
- What is the final outcome?
3. Identify Decision Points
Look for situations where the process can move in different directions. These are important decision points and should be clearly represented in the chart.
For example, a purchase approval process might include the question, “Is the request within budget?” A positive answer could continue to approval, while a negative answer could require revision or additional authorization.
4. Arrange the Steps in Order
Put the process steps into their correct sequence. Make sure each action leads logically to the next step or decision.
If several activities can happen at the same time, consider whether the chart needs to show parallel paths. Keeping the structure logical will make the final process diagram easier to read.
5. Connect the Steps
Use arrows or connectors to show how the process moves between steps. Avoid unnecessary crossing lines because they can make a chart difficult to follow.
6. Review and Simplify
After creating the first version, review the chart from the perspective of someone unfamiliar with the process. Remove unnecessary details, clarify confusing labels, and check that every major action has been represented.
A process chart should explain the workflow without becoming so complicated that users cannot easily follow it.
Process Chart Example
Consider a simple customer order process. The workflow might begin when a customer submits an order. The order is then reviewed to determine whether the requested product is available.
If the product is available, the order moves to payment processing and fulfillment. If it is unavailable, the customer may be contacted about an alternative product or a new expected delivery date.
This example demonstrates why process charts are useful. A written description may require several sentences, while a visual process diagram can show the same sequence and decision point at a glance.
How Process Charts Help Identify Bottlenecks
One of the most useful applications of a process chart is process improvement. Once a workflow has been mapped visually, teams can examine each stage and identify areas that slow down the overall process.
Common bottlenecks may include:
- Repeated approvals
- Unnecessary manual tasks
- Duplicate data entry
- Long waiting periods
- Unclear responsibilities
- Frequent rework
- Missing information
- Unnecessary handoffs between departments
For example, if a process requires three separate approvals for a routine task, the chart can make that sequence immediately visible. The organization can then determine whether all three approvals are necessary.
Process Chart for Training and Standardization
A process chart can be an effective training tool because it gives employees a visual overview of how a task should be completed.
New employees can use a process diagram to understand the correct order of activities, while experienced employees can use it as a quick reference. This is particularly useful for procedures that need to be performed consistently across a team.
Organizations can also include process charts in standard operating procedures, employee manuals, onboarding materials, project documentation, and internal training resources.
Tips for Designing an Effective Process Chart
A process chart should prioritize clarity over decoration. A visually attractive chart is useful only when readers can understand the workflow quickly.
- Use simple language: Keep step descriptions short and action-oriented.
- Maintain a logical direction: Use a consistent flow from start to finish.
- Use consistent shapes: Give similar types of information similar visual treatment.
- Make decisions obvious: Clearly label alternative outcomes such as Yes and No.
- Avoid excessive detail: Move supporting explanations to notes when appropriate.
- Use whitespace: Leave enough space between elements to improve readability.
- Keep labels readable: Avoid text that is too small or crowded.
- Review the completed chart: Test it with someone who understands the process and someone who does not.
Process Chart vs. Flowchart
The terms process chart and flowchart are sometimes used interchangeably. Both can visually represent steps, decisions, and workflow direction.
A process chart is generally focused on documenting or analyzing how a particular process works. A flowchart is a broader term for diagrams that represent the flow of information, actions, decisions, or systems.
In practical use, the distinction depends on the organization and context. The important consideration is whether the diagram clearly communicates the process to its intended audience.
Common Mistakes When Creating a Process Chart
A poorly designed process diagram can create confusion instead of improving understanding. Avoid these common problems:
- Starting without defining the scope: An overly broad process can become difficult to manage.
- Including every minor detail: Excessive information can hide the main workflow.
- Using unclear labels: Readers should understand each action without guessing.
- Leaving decisions unexplained: Alternative paths should have clear conditions.
- Creating tangled connectors: Crossing arrows can make the sequence difficult to follow.
- Ignoring the actual workflow: A chart should reflect how work is really performed, not only how it is supposed to work.
- Failing to update the chart: A process diagram can become inaccurate when procedures change.
How to Keep a Process Chart Up to Date
Processes change as organizations introduce new technology, responsibilities, policies, and procedures. A process chart should therefore be reviewed periodically.
Assigning an owner to the documented process can help ensure that changes are reflected in the chart. When a workflow changes, update the diagram and communicate the revised process to the people who use it.
It can also be helpful to include a version number, revision date, department, and person responsible for maintaining the chart. These details make it easier to identify the current version.
Frequently Asked Questions About Process Charts
What is the main purpose of a process chart?
The main purpose of a process chart is to visually explain how a process works. It shows the sequence of steps, decisions, and actions so users can understand, communicate, document, and improve the workflow.
What should a process chart include?
A process chart commonly includes a starting point, process steps, decision points, arrows or connectors, alternative paths, and an ending point. More detailed charts may also include responsibilities, notes, dates, or required documents.
What is the difference between a process chart and a flowchart?
A process chart generally focuses on documenting and analyzing a specific process, while a flowchart is a broader term for a diagram that represents the flow of actions, information, or decisions. In many situations, the terms are used interchangeably.
How can a process chart improve efficiency?
A process chart can reveal unnecessary steps, delays, repeated work, unclear responsibilities, and bottlenecks. Once these issues are visible, teams can evaluate opportunities to simplify or improve the workflow.
Can a process chart be used for employee training?
Yes. A process chart can provide employees with a visual reference for completing tasks correctly. It is particularly useful for onboarding, standard operating procedures, and workflows that require consistent execution.
What software can be used to create a process chart?
Process charts can be created using word processors, spreadsheet applications, presentation software, diagramming tools, or specialized workflow applications. For simple processes, a printable process chart template may also be enough.
Conclusion
A process chart is a practical way to visualize the steps, decisions, and actions involved in a workflow. By presenting a process in a structured visual format, it can improve understanding, communication, training, standardization, and project planning.
A well-designed chart can also help teams identify bottlenecks and unnecessary activities that may reduce efficiency. The most useful process charts are simple, accurate, logically organized, and easy for the intended audience to follow.
Whether you are documenting a business procedure, creating training material, planning a project, or improving an existing workflow, a clear process chart template provides a practical starting point for turning complex processes into understandable visual steps.
Download: Process Chart Template
