A profit and loss report is an essential financial document that summarizes a business’s revenue, costs, and expenses over a specific period. It shows whether a company generated a profit or incurred a loss and helps business owners understand their financial performance. By reviewing this report regularly, businesses can make better decisions about pricing, spending, budgeting, and future growth.
Whether you manage a small business, operate an online store, provide professional services, or oversee a larger company, a profit and loss report helps you understand where your money comes from and how it is spent. It can also help lenders, investors, and other stakeholders evaluate a company’s ability to generate income and manage its financial obligations.
In this guide, you will learn what a profit and loss report is, which financial figures it should include, how to prepare one, and how to use a printable profit and loss report template to monitor business performance.
What Is a Profit and Loss Report?
A profit and loss report, also known as a profit and loss statement or income statement, summarizes a company’s financial results during a defined period. This period may be a month, quarter, or financial year.
The report compares income with the costs and expenses incurred to generate that income. If revenue exceeds total expenses, the business generally reports a profit for the period. If expenses exceed revenue, it reports a loss.
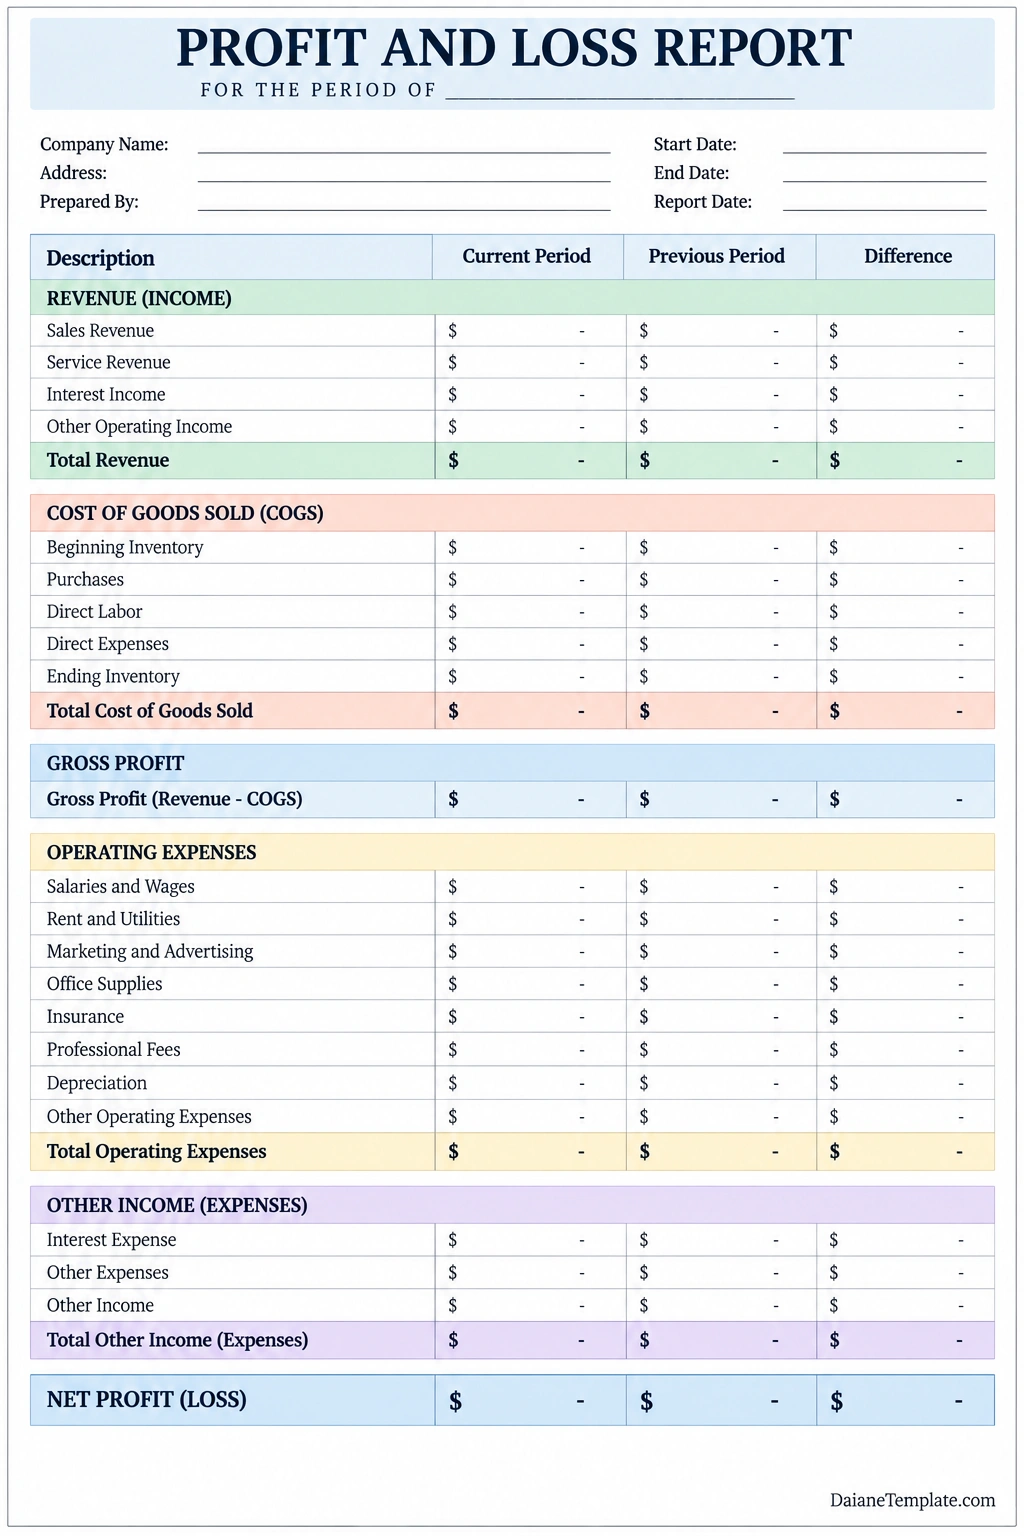
A typical profit and loss report includes:
- Revenue: Income earned from selling products or providing services.
- Cost of goods sold: Direct costs associated with producing or purchasing goods sold.
- Gross profit: Revenue remaining after subtracting the cost of goods sold.
- Operating expenses: Costs such as salaries, rent, utilities, marketing, and insurance.
- Other income and expenses: Items such as interest income, interest expense, or certain non-operating gains and losses.
- Net profit or loss: The final result after accounting for the applicable expenses and income items.
The exact categories depend on the type of business and the accounting method used. A service-based company, for example, may have no traditional inventory or cost of goods sold, while a retailer may need detailed inventory and purchasing records.
Why Is a Profit and Loss Report Important?
A profit and loss report helps business owners move beyond sales figures and understand whether their operations are financially sustainable. High revenue does not necessarily mean a company is profitable if its costs and expenses are also high.
1. Measures Business Profitability
The report shows how much income remains after the business accounts for its costs and expenses. This information helps owners evaluate whether their business model is generating an acceptable return.
2. Supports Better Financial Decisions
By reviewing expense categories and revenue trends, managers can identify areas where costs may be reduced or revenue could be improved. For example, rising delivery expenses or declining gross profit may indicate a need to review supplier agreements, pricing, or operational processes.
3. Helps with Budgeting and Forecasting
Historical financial results provide a useful starting point for preparing future budgets. Comparing actual performance with planned revenue and expenses helps businesses set realistic targets and anticipate potential financial challenges.
4. Provides Information for Lenders and Investors
External stakeholders may review a company’s income statement when evaluating financial performance, business risks, and its capacity to generate income. A consistent, well-supported report can make financial discussions more productive, although lenders and investors usually consider other information as well.
5. Highlights Trends and Potential Problems
Comparing reports across multiple periods can reveal changes that are difficult to notice from a single month’s results. A gradual increase in operating expenses, lower sales revenue, or shrinking profit margins may signal that the business needs to investigate its operations.
What to Include in a Profit and Loss Report Template
A useful profit and loss report template organizes financial information into clear sections. The following categories provide a practical starting point for many small and medium-sized businesses.
Revenue or Income
Record income earned during the reporting period. Depending on the business, revenue may come from product sales, service fees, subscriptions, commissions, or other operating activities. Separate major revenue streams when doing so helps explain business performance.
Cost of Goods Sold
Cost of goods sold, often abbreviated as COGS, represents the direct costs associated with goods sold during the period. For a retailer, this may include the cost of purchased merchandise and inventory adjustments. A manufacturer may also include direct production costs under its applicable accounting policies.
For businesses that maintain inventory, the calculation commonly uses beginning inventory, purchases and other applicable inventory costs, and ending inventory. The precise calculation should follow the company’s accounting method and applicable standards.
Gross Profit
Gross profit is calculated by subtracting the cost of goods sold from revenue. It shows how much remains from sales before operating expenses and other applicable items are deducted.
A decline in gross profit may result from lower selling prices, higher supplier costs, product mix changes, or other factors. Reviewing gross profit alongside revenue helps explain whether sales are becoming more or less profitable.
Operating Expenses
Operating expenses are the costs of running the business that are not included in cost of goods sold. Common examples include:
- Salaries, wages, and employee-related costs.
- Rent, electricity, water, and internet services.
- Marketing and advertising expenses.
- Office supplies and software subscriptions.
- Insurance and professional service fees.
- Depreciation and other applicable operating costs.
Other Income and Expenses
This section captures relevant items that are not part of the company’s primary operating activities. Examples may include interest income, interest expense, or certain gains and losses. Classification depends on the company’s accounting policies and reporting requirements.
Net Profit or Loss
Net profit or loss represents the final financial result after revenue and the relevant costs, expenses, and other items have been accounted for. Depending on the report’s structure, income tax expense may also need to be included before arriving at net income.
Make sure the report clearly defines which items are included in the final figure so it can be interpreted correctly.
How to Prepare a Profit and Loss Report
Preparing an accurate profit and loss report starts with reliable financial records. Follow these steps to organize the figures and produce a useful summary of business performance.
Step 1: Choose the Reporting Period
Decide whether you need a monthly, quarterly, or annual report. Monthly reports are useful for regular monitoring, quarterly reports help identify medium-term trends, and annual reports provide a broader view of financial performance. Use consistent reporting periods when comparing results.
Step 2: Gather Financial Records
Collect the information needed to report revenue and expenses. Relevant records may include sales invoices, receipts, supplier bills, payroll records, inventory reports, bank reconciliations, and accounting-system data. Reconcile the records and investigate discrepancies before calculating totals.
Step 3: Calculate Total Revenue
Add the revenue earned during the reporting period using the accounting method followed by the business. Keep supporting records and apply consistent rules for refunds, discounts, returns, and other adjustments.
Step 4: Calculate Cost of Goods Sold
If the business sells products or maintains inventory, determine the applicable cost of goods sold. Review inventory figures, purchases, and direct costs according to the company’s accounting policies. Service-based businesses may instead record relevant direct service costs in the appropriate expense categories.
Step 5: Total Operating Expenses
Group operating expenses into clear categories and calculate each category’s total. Check that costs are assigned consistently and avoid counting the same transaction twice. Keep supporting documentation for unusual or significant expenses.
Step 6: Calculate Profit or Loss
Subtract cost of goods sold from revenue to calculate gross profit. Then deduct operating expenses and account for other relevant income, expenses, and taxes according to the report’s structure. Review the final result to confirm that the calculations are accurate and the categories are complete.
Step 7: Compare Results and Review Trends
Where possible, compare the current period with the previous month, quarter, year, or budget. Investigate significant changes in revenue, gross profit, operating expenses, and net income. Add notes explaining unusual results so the report becomes a decision-making tool rather than simply a list of numbers.
How to Analyze a Profit and Loss Report
Once the report is prepared, use it to understand what is driving the business’s financial performance. Looking at several figures together often provides more insight than reviewing net profit alone.
Review Revenue Trends
Compare revenue across reporting periods and identify the products, services, or customer groups contributing to growth or decline. Consider seasonal patterns and one-time transactions before drawing conclusions.
Monitor Gross Profit Margin
Gross profit margin measures the percentage of revenue remaining after cost of goods sold.
Gross Profit Margin = (Gross Profit ÷ Revenue) × 100
For example, if a business earns $50,000 in revenue and has $30,000 in cost of goods sold, its gross profit is $20,000 and its gross profit margin is 40%. Compare this figure with previous periods and relevant business benchmarks rather than relying on a universal target.
Evaluate Operating Expenses
Look for expenses that are increasing faster than revenue or that differ significantly from the budget. A higher expense is not automatically a problem, since it may support growth, but it should be understood and evaluated against the results it produces.
Track Net Profit Margin
Net profit margin measures the percentage of revenue remaining as net profit after the expenses included in the calculation.
Net Profit Margin = (Net Profit ÷ Revenue) × 100
Monitoring this ratio over time can help reveal whether the business is becoming more or less profitable. Interpret it alongside cash flow, debt obligations, and other financial information because accounting profit does not necessarily mean the business has sufficient cash available.
Tips for Maintaining an Accurate Profit and Loss Report
- Keep records organized: Record transactions regularly and store supporting documents in an accessible system.
- Use consistent categories: Apply the same account classifications from one reporting period to the next.
- Reconcile financial records: Check account balances and investigate missing or duplicated transactions.
- Separate business and personal expenses: Keep business transactions distinct to make reporting more reliable.
- Compare actual results with the budget: Investigate material differences and document corrective actions.
- Review unusual items: Identify one-time income or expenses that may distort comparisons between periods.
- Protect financial information: Limit access to sensitive business records and share reports only with appropriate recipients.
- Seek professional help when needed: Consult an accountant or qualified bookkeeper about complex transactions and applicable reporting requirements.
Profit and Loss Report vs. Balance Sheet and Cash Flow Statement
A profit and loss report is one part of a business’s financial reporting. It becomes more useful when considered alongside other financial statements.
Profit and Loss Report
The profit and loss report summarizes revenue, expenses, and profitability over a period. It helps explain how the business performed financially during that time.
Balance Sheet
A balance sheet shows the company’s assets, liabilities, and equity at a specific date. It provides a snapshot of the business’s financial position rather than its performance over a period.
Cash Flow Statement
A cash flow statement reports cash inflows and outflows from operating, investing, and financing activities. It helps explain how cash moves through the business and why reported profit may differ from the change in cash balance.
Reviewing these reports together gives owners and stakeholders a more complete understanding of profitability, financial position, and liquidity.
Frequently Asked Questions
What is another name for a profit and loss report?
A profit and loss report is also commonly called a profit and loss statement, P&L statement, or income statement. The exact terminology may vary by organization and accounting framework.
How often should a business prepare a profit and loss report?
Many businesses prepare reports monthly and review them regularly. Quarterly and annual reports can provide additional perspective. The appropriate frequency depends on the business’s size, reporting needs, and decision-making schedule.
What is the difference between gross profit and net profit?
Gross profit is revenue minus the cost of goods sold. Net profit reflects the result after accounting for the relevant operating expenses and other income and expenses, including taxes where applicable. Net profit therefore provides a broader view of the final financial result.
Can a business have high revenue but still make a loss?
Yes. A business can generate substantial revenue and still report a loss if its cost of goods sold, operating expenses, and other applicable expenses exceed its income. Reviewing the expense categories helps identify the reasons for the loss.
Can I use a profit and loss report template in Excel?
Yes. A spreadsheet template can organize financial categories and calculate totals using formulas. Check formulas carefully, use consistent accounting categories, and reconcile the figures with the underlying records before relying on the report.
Does a profit and loss report show cash available in the business?
No. A profit and loss report measures financial performance under the applicable accounting method, not the cash currently available. A business can report a profit while experiencing cash shortages due to unpaid invoices, debt repayments, inventory purchases, or other cash movements.
Who uses a profit and loss report?
Business owners, managers, accountants, lenders, and investors may use profit and loss reports to evaluate performance, review costs, assess profitability, and support financial decisions. The information required may vary depending on the user’s purpose.
Conclusion
A profit and loss report is a valuable tool for understanding business revenue, costs, expenses, and profitability over a defined period. By organizing financial information into clear categories, it helps business owners identify trends, monitor spending, evaluate margins, and make better decisions about pricing, budgeting, and growth.
Use a profit and loss report template to standardize your reporting process, compare results across periods, and keep important financial information organized. For the most useful results, maintain accurate records, review unusual changes, and consider the report alongside the balance sheet and cash flow statement.
Disclaimer: This article and template are provided for general informational purposes only and do not constitute accounting, tax, investment, or financial advice. Reporting requirements and accounting treatments vary by business and jurisdiction. Consult a qualified accounting professional for guidance specific to your circumstances.
Download: Profit And Loss Report Template
