A project chart is a practical tool for organizing tasks, visualizing timelines, tracking progress, and keeping a project on schedule. Whether you are managing a business initiative, coordinating a team assignment, planning an event, or overseeing a personal project, a clear chart helps you understand what needs to be done, when tasks should happen, and how different activities fit together.
Without a visual project plan, deadlines can be overlooked, responsibilities may become unclear, and delays can be difficult to identify. A well-organized project chart brings essential information into one place, making it easier to communicate priorities, monitor milestones, and make informed decisions throughout the project lifecycle.
In this guide, you will learn what a project chart is, explore common chart types, discover what information to include, and find practical tips for using a printable project chart template to manage your work more effectively.
What Is a Project Chart?
A project chart is a visual representation of project information, such as tasks, schedules, milestones, responsibilities, dependencies, and progress. It transforms a project plan into an easy-to-understand format that helps individuals and teams see the overall picture.
The exact layout depends on the project’s purpose. Some charts focus on timelines and task durations, while others show task relationships, project phases, or completion percentages. The goal is to make project information easier to review and use.
A typical project chart may include:
- Project details: The project name, manager, start date, and target completion date.
- Task list: The activities required to complete the project.
- Timeline: The dates or periods assigned to each task.
- Milestones: Important achievements or decision points.
- Task owners: The people responsible for specific activities.
- Progress indicators: The percentage of work completed or the current status.
- Dependencies: Relationships between tasks that determine their order.
- Notes: Risks, blockers, decisions, and follow-up actions.
Why Is a Project Chart Important?
A project chart helps turn a broad objective into a manageable sequence of activities. Instead of relying on memory or scattered notes, project participants can refer to a shared visual plan to understand their responsibilities and deadlines.
1. Improves Project Planning
Creating a chart requires you to identify the tasks needed to achieve your project goals. Breaking the work into smaller activities makes it easier to estimate the time, resources, and effort required for each phase.
2. Makes Deadlines Easier to Track
A project timeline provides a visual overview of scheduled activities and due dates. When a task falls behind, you can identify the delay earlier and determine whether other deadlines need to be adjusted.
3. Clarifies Responsibilities
When tasks have assigned owners, team members know who is responsible for completing each activity. This reduces confusion, supports accountability, and makes follow-up conversations more productive.
4. Helps Identify Bottlenecks
A project chart can reveal overlapping tasks, unrealistic deadlines, and activities that depend on unfinished work. Identifying these issues early gives the team more time to adjust resources or revise the schedule.
5. Supports Better Communication
A visual project plan gives stakeholders a common reference point. Managers can use it to explain priorities, discuss progress, communicate changes, and highlight upcoming milestones without reviewing every project detail individually.
Common Types of Project Charts
Different projects require different ways of displaying information. Choosing the right chart depends on the project’s size, complexity, timeline, and management needs.
Gantt Chart
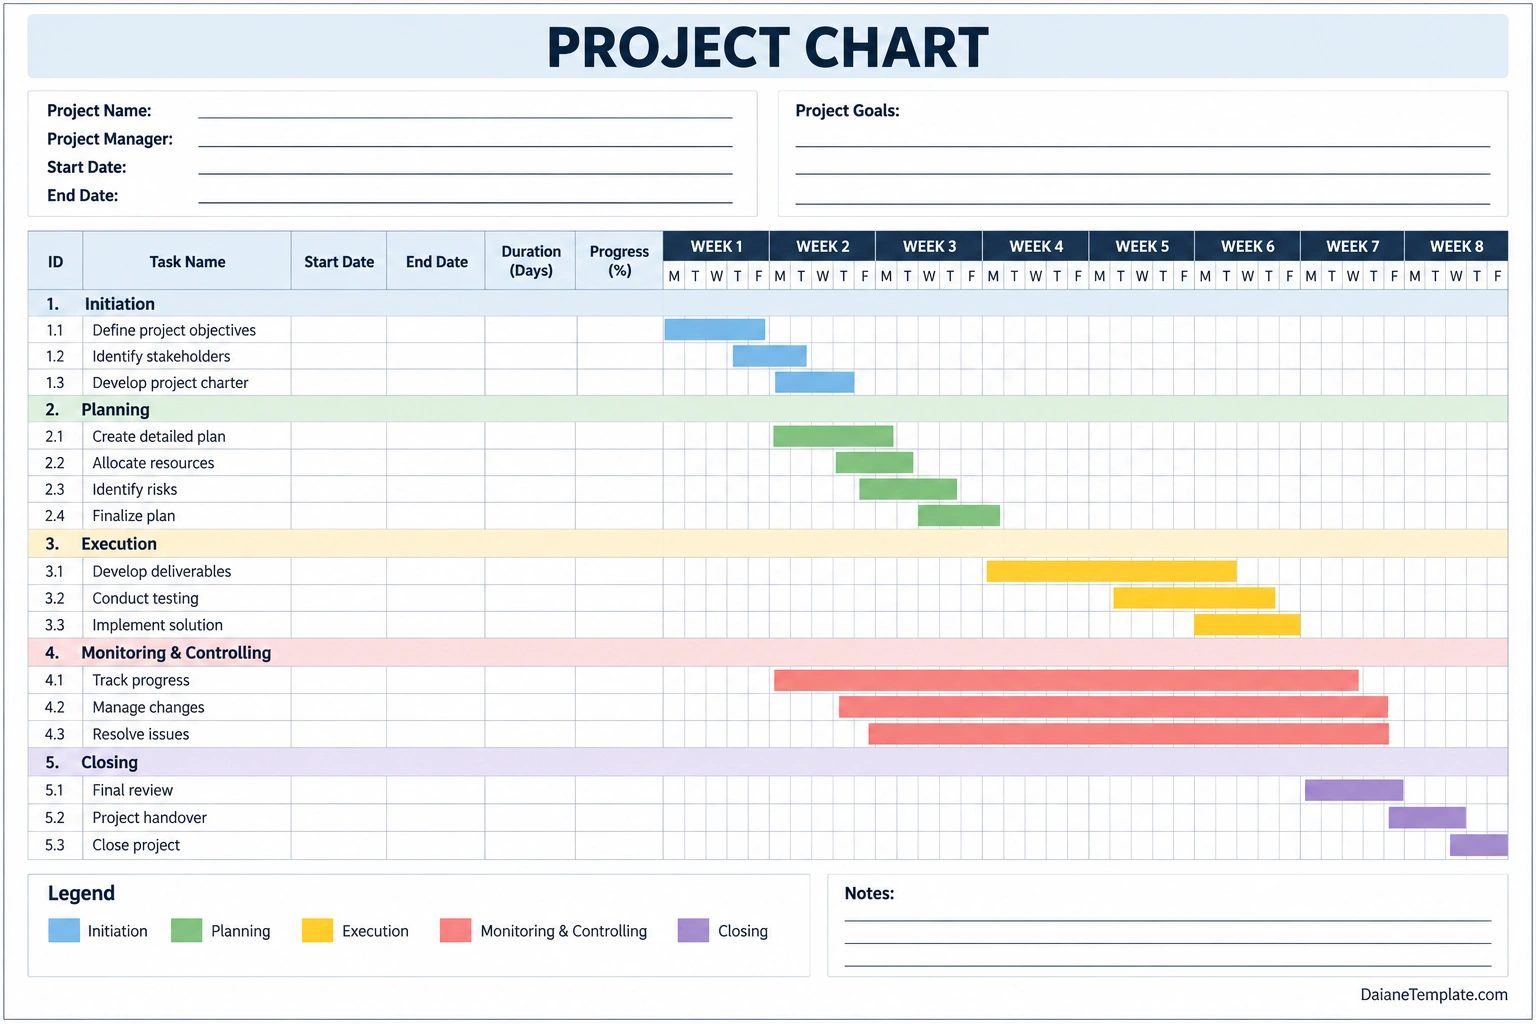
A Gantt chart displays project tasks along a timeline using horizontal bars. Each bar represents a task’s planned start date, duration, and end date. Depending on the layout, it may also show dependencies, milestones, and actual progress.
Gantt charts are particularly useful for construction projects, product launches, marketing campaigns, software development, and other projects with multiple activities scheduled over time.
Milestone Chart
A milestone chart highlights significant events or achievements rather than displaying every task. Examples include completing a design, approving a budget, launching a product, or delivering a final report.
This format is useful for executive updates and projects where stakeholders mainly need to understand major deadlines and decision points.
Work Breakdown Chart
A work breakdown chart organizes project deliverables into smaller components. It helps project managers define the scope of work and understand how major objectives can be divided into manageable tasks or work packages.
Kanban Board
A Kanban board organizes tasks into columns representing workflow stages, such as To Do, In Progress, and Completed. It is useful for monitoring ongoing work and identifying tasks that are waiting for attention.
Progress Chart
A progress chart compares planned work with actual performance. It may display completion percentages, completed milestones, or other project indicators. This format helps managers determine whether the project is progressing as expected.
What to Include in a Project Chart Template
A useful project chart template should present the information needed to plan work, monitor progress, and make adjustments. You can customize the following sections to match your project requirements.
Project Name and Basic Information
Start with the project name, project manager, start date, target end date, and main objective. These details establish the purpose and timeframe of the chart.
Task Names and Identification Numbers
List each activity in a logical order. If the project contains several phases, group related tasks under headings such as Initiation, Planning, Execution, Monitoring, and Closing. Task identification numbers can make discussions and progress reports easier to follow.
Start Dates, End Dates, and Duration
Record the expected start and finish dates for each task. Calculate the estimated duration using a consistent method, such as calendar days or working days. This helps you compare tasks and identify schedule conflicts.
Progress and Status
Use a percentage, status label, or visual indicator to show how much work is complete. Common status labels include Not Started, In Progress, At Risk, Blocked, and Completed. Define the labels clearly so everyone interprets them consistently.
Timeline and Dependencies
For a timeline-based project chart, use columns representing days, weeks, or months. Mark the periods during which each task is scheduled. Identify dependencies when one activity cannot begin until another has been completed or a specific decision has been made.
Notes and Project Risks
Include space for blockers, decisions, changes, and follow-up actions. Recording important notes alongside the schedule helps prevent issues from being forgotten between project reviews.
How to Create and Use a Project Chart
You do not need a complicated system to build a useful project chart. Follow these steps to create a practical plan that your team can maintain throughout the project.
Step 1: Define the Project Goal
Write a clear statement describing the intended result. A specific goal helps you determine which activities are necessary and how success will be measured.
Step 2: Break the Work into Tasks
Divide the project into manageable activities. Avoid tasks that are so broad that progress becomes difficult to measure. For example, replace “Prepare marketing campaign” with separate tasks for audience research, content creation, design approval, scheduling, and launch.
Step 3: Estimate Task Durations
Estimate how long each activity should take and assign realistic deadlines. Consider resource availability, approval processes, possible delays, and dependencies. Build in reasonable contingency time for activities with uncertain completion dates.
Step 4: Assign Owners and Responsibilities
Identify the person responsible for each task. Where multiple people contribute, specify who owns the final result and who must provide input or approval.
Step 5: Add Tasks to the Timeline
Place each activity on the chart according to its planned start date and duration. Schedule dependent activities in the correct order and avoid assigning unrealistic workloads to the same person or resource.
Step 6: Update Progress Regularly
Review the chart on a consistent schedule, such as weekly or at key project meetings. Update task statuses, revise dates when necessary, and record any blockers that could affect the final deadline.
Step 7: Review and Adjust the Plan
When the project changes, update the chart to reflect the latest approved plan. Consider how a delay in one task affects dependent activities, milestones, resources, and the overall completion date. Communicate significant changes to everyone who needs to know.
Tips for Managing Projects with a Chart
- Keep the layout readable: Use clear task names and avoid filling the chart with unnecessary details.
- Choose a suitable time scale: Use daily intervals for short projects and weekly or monthly intervals for longer initiatives.
- Use consistent status indicators: Apply the same labels or colors throughout the chart.
- Track actual progress: Update the chart using current information rather than relying on estimates that are no longer accurate.
- Highlight critical milestones: Make major deadlines and approval points easy to identify.
- Review dependencies: Check whether delayed tasks could affect other activities or the final delivery date.
- Assign clear ownership: Make sure every important task has a responsible person.
- Maintain one reliable version: If the chart is shared digitally, identify the current version and communicate changes. For printed charts, add an update date.
Printable Project Chart vs. Digital Project Management Tools
A printable project chart is a simple option for planning sessions, team meetings, personal projects, and situations where a physical overview is convenient. You can write task details by hand, mark progress, and review the timeline without opening an application.
Digital project management tools may be more suitable for large or frequently changing projects. Many provide automated reminders, task assignments, collaborative updates, reporting, and dependency tracking. These features can save time when multiple people need to maintain the same plan.
Choose the format that matches your workflow. A printable project chart may be sufficient for a small project with a straightforward timeline, while a complex project may benefit from dedicated software. You can also use both: maintain a digital master plan and print a simplified chart for meetings or quick reference.
Frequently Asked Questions
What is the main purpose of a project chart?
The main purpose of a project chart is to visualize tasks, schedules, milestones, and progress so that project work is easier to plan, coordinate, and monitor. It helps teams understand priorities and identify potential problems before they cause significant delays.
What is the difference between a project chart and a Gantt chart?
A project chart is a broad term for visual tools used to organize project information. A Gantt chart is a specific type of project chart that displays tasks against a timeline, usually using horizontal bars to represent task duration.
What information should a project chart contain?
A project chart commonly includes the project name, tasks, start and end dates, duration, milestones, responsibilities, and progress indicators. Depending on the project’s needs, it may also include dependencies, risks, notes, and resource information.
Can I use a project chart for personal projects?
Yes. A project chart can help organize home renovations, event planning, study schedules, creative projects, and other personal goals. Breaking work into tasks and setting realistic deadlines makes it easier to track progress and stay organized.
How often should I update a project chart?
Update the chart frequently enough to reflect meaningful changes. Weekly updates may work for many projects, while fast-moving initiatives may require daily reviews. The best schedule depends on project complexity, deadlines, and how quickly conditions change.
Is a printable project chart better than project management software?
Neither option is always better. A printable chart is simple and convenient for smaller projects or in-person planning. Digital tools are often more useful for complex projects that need collaboration, notifications, reporting, or automated dependency tracking.
How do I track project progress using a chart?
Compare the planned schedule with actual task status and completion dates. Update progress percentages or status labels, identify delayed activities, and determine whether the delays affect dependent tasks or major milestones. Record corrective actions when needed.
Conclusion
A project chart makes planning and project tracking easier by bringing tasks, timelines, milestones, and progress information into a clear visual format. It helps individuals and teams coordinate responsibilities, identify bottlenecks, and make timely adjustments when project conditions change.
Start by defining your goal, breaking the work into manageable tasks, assigning realistic deadlines, and reviewing progress regularly. Use a printable project chart template for a simple overview or combine it with digital project management software when your workflow requires more advanced features. With consistent updates and clear responsibilities, a project chart can become a valuable tool for keeping work organized and projects moving toward completion.
Download: Project Chart Template
